How to Cite | Publication History | PlumX Article Matrix
Evaluation of Net Recharge in Al Salt Urban Area/ Jordan Using Scs Curve Number Method
Amany Ta’any, Rakad Ta'any, Omar Rimawi and Ali Elnaqa
Al Balqa’ Applied University, Faculty of Agricultural Technology, As Salt 19117 Jordan.
ABSTRACT: This study deals with the calculation of net recharge at Al Salt urban area. The “Net Recharge” is the annual total quantity of water which infiltrates from the ground surface to the aquifer. It is expressed as the annual recharge rate (mm/year) evaluated on the basis of field measurements, derived from the water balance equation, or estimated with the help of aerial photographs or satellite imagery. Precipitation is the primary source of groundwater because it seeps through the unsaturated zone to the water table. The amount and quality of recharge significantly affects the physical and chemical processes in the soil-rock-groundwater system. The greater the recharge the greater the contamination potential because, it may lead to leaching and transporting contaminants from the ground surface to the water table. In the present research the water balance equation was applied to calculate the net recharge in the study area. This equation was used to perform the water balance on daily basis for each storm event during the period under investigation. Rainfall is usually concentrated between December and March; in this period rainfall duration is long and evaporation is low, so that it can be concluded that recharge occurs mostly during this period. The rainfall is the only parameter in the study area; therefore, daily rainfall and initial abstraction were calculated from five rainfall stations using the SCS-Curve Number method for each storm during a specific year. The potential evaporation was computed using Penman Equation, and then the water balance was solved for all storms that occurred during the period of the water years (1989-2007). The calculated average annual recharge to the upper aquifer was about 10 MCM. The recharge rate ranges between 9.6 and 12.2 %. In general, the mean groundwater ranges from about 20 – 80 mm/year. The rating for the recharge parameter in the studied area ranges from 1 to 3. The highest value refers to higher recharge rate and the lowest value indicates the lower recharge.
KEYWORDS: Rainfall; net recharge; aquifer; contamination; balance; DRASTIC; Jordan
Download this article as:| Copy the following to cite this article: Ta’any A, Ta'any R, Rimawi O. Elnaqa A. Evaluation of Net Recharge in Al Salt Urban Area/ Jordan Using Scs Curve Number Method. Biosci Biotechnol Res Asia 2009;6(1).. |
| Copy the following to cite this URL: Ta’any A, Ta'any R, Rimawi O. Elnaqa A. Evaluation of Net Recharge in Al Salt Urban Area/ Jordan Using Scs Curve Number Method. Biosci Biotechnol Res Asia 2009;6(1). Available from: https://www.biotech-asia.org/?p=20095 |
Introduction
Water is one of Jordan’s scarcest resources; about 80 percent of the country is steppe and desert where water is only minimally available. Most of the municipal water supply systems and industry in Jordan presently depend on ground water and springs. Most of these sources are currently being extracted to or beyond the capacity of the reliable aquifer yields [1].
The present use of water resources in the study area is dependent on the ground water resources (spring and pumped wells). There are 22 springs in the study area of which, 9 springs emerge from Wadi Es-Sir Aquifer (A7), 5 springs from Hummar Aquifer (A4), and 8 springs from the Na’ur Aquifer (A1/2). The average discharge of these springs ranges between 0.6 m3/hr. The exploited aquifer systems in the study area are Wadi Es-Sir Aquifer (A7), Hummar Aquifer (A4), and Na’ur Aquifer (A1/2).
Rainfall is the primary source of water in the study area. Mean annual rainfall in the catchment area ranges from less than 200 mm at Shunet Nimrin to more than 600 mm at Salt rainfall station and is a function of Land-surface altitude.
The main objectives of this work are to calculate the water budget of the study area using the water budget approach and to determine spatial and temporal distribution of hydrogeologic characteristics of the groundwater aquifer systems in the Salt area.
The Study Area
Location
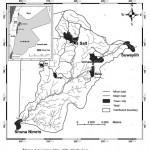
The study area lies between the coordinates 209-229 E and 144-165 N (according to Palestine grids), and covers an area of about 185 square kilometers. It is bounded by Allan and Zerqa River from the North, Wadi Kafrein from the south, Wadi Es-sir and Amman city from the east and the Jordan River from the west. The catchment area also, covers the localities of Salt city, Hummar, Fuheis, Mahis and Wadi Shu’eib, Figure 1.
 |
Figure 1: Location Map of the Study Area.
|
The area is dominated by the sedimentary rocks of the Belqa and Ajlun Groups, which are underlined by the Kurnub Sandstone rocks exposed at the lower limit of Wadi Shu’eib Catchment area. The vegetation cover is typical of semi-arid climate zone and the soil is originated from the top weathered rocks and the alluvium deposits.
Topography and Drainage
The general shape of the catchment area is rectangular, with the longer axis oriented NE-SW direction. The general slope of the area is from E to W, and the average slope of the stream channels varies between 4 and 7.5 %. Elevation ranges from1118 m above the sea level (a.s.l.) at En Nabi Yusha’ to about 100m below the sea level at Shunet Nimrin. The average elevation of the catchment area is about 600m above the mean sea level (a.s.l.).
There are several wadis drain in the catchment area, the main wadis beings, Wadi Es-Salt, Wadi El-Azraq, Wadi Bir Es-Sabil, Wadi El-Amir, Wadi Shu’eib and Wadi Jureia’. All of these wadis drain from East to West, That is, from the highland areas to the lowlands of the Jordan Valley, and Flushing floods in the winter season into Wadi Shu’eib Dam Reservoir Which was constructed at the lower reach of the study area.
Materials and Methods
Geology and Hydrogeology
The geology of the study area consists of arenaceous deposited of Lower Cretaceous and carbonate rocks of Middle to Upper Cretaceous. These deposits are divided into three groups, Kurnub (K), Ajlun (A) and Belqa (B) group in ascending order. the Belqa /Ajlun group (B/A) is underlain by the Kurnub (K) layer composed of sandstone layers of lower cretaceous period , which crops out at the lower limit of Wadi Shu’eib catchment area. The A/B (two groups of middle to upper cretaceous) is divided into several formations of A1 to A7, and B1 to B2. Some of the formation might strictly be considered as (sub-groups) and the groups as (super groups) but the division has been based on previously used mapping units and on a general classification of units into aquifers and aquicludes. For those units which could be further divided, a double number has been assigned. For example the A1/2 formation, the Na’ur limestone and marl formation can be split in some districts and this has been done wherever possible.
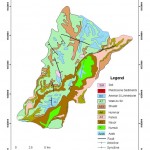
The study area is covered by the Cretaceous rocks, which are subdivided into two main sequences. The Lower Cretaceous sandstone sequence (Kurnub) which is overlain by marine Upper Cretaceous limestone, dolomites, marls and cherts. The areal distributed of the outcropping formation is shown in figure 2.
 |
Figure 2: Geological Map of the Study Area.
|
The aquifer systems in Wadi Shu’eib Catchment area are sub-divided into the following [2]:
The lower cretaceous Aquifer complex (Kurnub sandstones).
The Upper cretaceous Aquifer complex.
The Kurnub Aquifer complex of the lower cretaceous consists of massive, white sandstones and varicolored sandstones reaching a total thickness of about 300 m [3].The Upper cretaceous Aquifer complex consists of an alternating sequence of limestones, dolomites, marls and cherts.
In the study area, the A7 limestone formation has a good potential because of its extensive development of solution cannels, fractures and its large thickness. Infiltration is controlled mainly by the steep slopes, but is quite good due to the relatively high rainfall in the area .The limestones of the A1/2 formation are good aquifer. Facies changes within the A4 limestone formation limit its potential. The marls and marly limestones of the remainder of the Ajlun Group (A3 and A5/6) must be considered as aquicludes.
The specific capacity of the aquifer system in the study area is determined to be in the rage of 0.01 to 250 m2/hr in few wells it goes up to 6200 m2/hr. The transmissibility ranges between 0.1 to 100.000 m2/day, and the hydraulic conductivity ranges between 2.9*10-8 to 3.25*10-2 m/s [4]. Similar values are also found by [5] and [6].
Determination of the areal rainfall
There are five rainfall stations in the study area; all stations measure the daily rainfall, and two of them have also rainfall recorders, giving hourly rainfall events. The distribution of rainfall over the study area was represented in two methods; these are Thiessen polygon technique and Isohyetal Method.
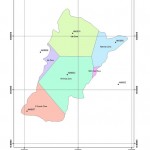
Thiessen polygon was applied to estimate the areal rainfall for each considered storm. In this method it is assumed that the point rainfall at the station is representing the areal rainfall in its polygon, or its area of rainfall influence. Figure 3, shows the Thiessen polygons for the catchment area. The rainfall distribution and water year conditions are listed in table 1.
Table 1: Annual rainfall distribution and water year conditions (by Thiessen Method).
| Water Year | Rainfall Stations | Weighted
Rainfall (mm) |
Water Year
Condition |
||||
| Salt
29.7% |
Hummar
13.50% |
W. Shu’eib
35.20% |
Ira
4.30% |
Shuna South
17.30% |
|||
| 1985/1986 | 205.7 | 81.9 | 144.5 | 16.7 | 40.8 | 489.5 | Wet |
| 1986/1987 | 148.1 | 68.2 | 100.9 | 10.3 | 21.3 | 348.7 | Dry |
| 1987/1988 | 201.7 | 99.7 | 155.4 | 18.5 | 31.2 | 506.5 | Wet |
| 1988/1989 | 139.0 | 68.2 | 104.4 | 11.8 | 25.1 | 348.5 | Dry |
| 1989/1990 | 119.2 | 57.1 | 122.7 | 11.5 | 24.3 | 334.9 | Dry |
| 1990/1991 | 301.2 | 136.1 | 247.7 | 24.1 | 52.7 | 761.8 | Wet |
| 1991/1992 | 302.7 | 137.5 | 211.2 | 22.7 | 42.1 | 716.3 | Wet |
| 1992/1993 | 113.5 | 48.9 | 81.3 | 10.7 | 15.1 | 269.5 | Dry |
| 1993/1994 | 251.4 | 99.9 | 178.6 | 16.0 | 41.8 | 587.7 | Wet |
| 1994/1995 | 55.3 | 27.2 | 47.5 | 4.8 | 10.3 | 145.0 | Dry |
| 1995/1996 | 162.8 | 69.6 | 121.1 | 11.0 | 30.2 | 394.7 | Normal |
| 1996/1997 | 197.8 | 76.6 | 177.5 | 16.6 | 42.7 | 511.3 | Wet |
| 1997/1998 | 107.8 | 51.9 | 65.8 | 6.3 | 17.1 | 248.9 | Dry |
| 1998/1999 | 70.3 | 36.0 | 54.0 | 2.9 | 10.4 | 173.6 | Dry |
| 1999/2000 | 140.2 | 73.9 | 128.8 | 12.6 | 25.7 | 381.2 | Normal |
| 2000/2001 | 119.0 | 56.3 | 97.7 | 8.1 | 24.6 | 305.7 | Dry |
| 2001/2002 | 240.8 | 92.7 | 169.8 | 15.7 | 44.3 | 563.4 | Wet |
| 2002/2003 | 197.2 | 64.3 | 149.3 | 14.0 | 35.4 | 460.2 | Normal |
| 2003/2004 | 162.1 | 40.5 | 98.6 | 9.9 | 29.7 | 340.8 | Dry |
| 2004/2005 | 187.8 | 14.5 | 102.1 | 8.7 | 23.8 | 336.8 | Dry |
| 2005/2006 | 148.2 | 54.2 | 106.9 | 8.4 | 19.6 | 337.5 | Dry |
| 2006/2007 | 137.8 | 57.6 | 99.3 | 7.8 | 20.2 | 322.8 | Dry |
 |
Figure 3: Thiessen Polygon network of Wadi Shu’eib catchment area.
|
Run off
There are no gauging stations located in Wadi Shu’eib Catchment Area. Therefore, to estimate the runoff which may occur in the winter season, the US Soil conservation services method (SCS), [7], was applied to calculate the runoff occurred from different storms of normal condition. This method takes in consideration the antecedent moisture conditions (AMC), the initial abstraction of rainfall, and the land use.
The first step for the use of the SCS model was to estimate the volume of direct of runoff, (Q), in inches.
Q = (P – Ia) 2 / (P- Ia + S) ………..……. (1)
Where:
Q: is the accumulated depth of runoff in inches.
P: is the accumulated depth of storm rainfall in inches.
Ia: is the depth of the initial abstraction in inches.
Ia and S are related to soil cover conditions. Also the relation between initial abstraction (Ia) and potential abstraction (S) was derived from the studies of different watersheds in the United States of America as,
Ia = 0.2 S ……………..……….. (2)
The above equation for the accumulated runoff is formulated as:
Q = (P – 0.2 S) 2 / (P + 0.8 S) …………… (3)
The relation between the Curve Number (CN) And S was established by as,
S = (1000 / CN) – 10 ……………..…….. (4)
These universal equations are the basis of the runoff model used in this study where the flows were derived
Evapotranspiration
The purpose of calculating the evapotranspiration in Wadi Shu’eib Catchment area is to estimate the direct recharge into the groundwater of the Upper aquifer system (A7). The potential evapotranspiration was calculated using Turc Equations. This equation is written as follows:
![]()
Where:
E: the annual actual evaporation (mm)
P: the average annual precipitation (mm)
T: the temperature function, which is equal to,
f(t) = 300 + 25 t + 0.05 t3
The essential climatological data which were needed for the computation of the potential evapotranspiration had been collected from Ministry of water and irrigation (MWI) files. In order to obtain the actual evaporation from rainfall, the potential evaporation was calculated during the occurrence of the rainfall storm.
Results and Discussion
The occurrence of large springs generally, depends chiefly on the kind of rocks that yield water. Limestone and extrusive volcanic rocks are the main sources of the large springs in Jordan. The volcanic rock is chiefly basalt that was greatly jointed and broken at the time it solidified; large springs may also issue from sandstone rocks. The limestone is the main source of the major springs in the study area.
The rate and quantity of water that infiltrates into the ground is a function of soil type, soil moist is permeability, ground cover, drainage conditions and duration of rainfall. It is well known that when water reaches the surface of a soil, a part of it seeps into the soil; this movement of water through the soil surface is known as infiltration and plays a significant role in the runoff process. Hence, infiltration is the primary step in the natural ground recharge.
Runoff is a function of precipitation, soils, ground cover, elevation of catchments and slope; of these factors precipitation is the most variable, [9]. As mentioned previously, there are no gauging stations in the study area up to date. Accordingly, runoff is calculated using the SCS Curve Number Method, which relates storm runoff to rainfall by a relationship that depends primarily upon the potential abstraction of water by soil storage. High potential abstraction means less runoff for a given rainfall, represented by a lower curve number.
The curve number of the study area is estimated to be (60), derived from the soil classification, and the use of topographic maps.
CN = 60
S = 1000/CN – 10
S = 1000/60 – 10 = 6.667 inches
The initial abstraction prior the runoff is,
Ia = 0.2 S
Ia = 0.2* (6.667) = (1.333) inches
Ia = 1.333 * 25.4 = 33.86 mm
The runoff formula becomes
Q = (P – 0.2(169.33)) 2 / (P + 0.8(169.33))
Q = (P – 33.86) 2 / (P + (135.46))
This formula was used to estimate the runoff from each effective storm for wet, normal and dry condition using storm analysis. It is worth to see here that if the storm is less than the initial abstraction that means no runoff will be occurred.
Table 2, summarizes the annual runoff for Wadi Shu’eib catchment area for wet, normal and dry conditions. It is seen that the annual runoff ranges between 2.30 MCM in the dry water year (2006 / 2007) and between 6.59 in wet water year (2001 / 2002). The long term average runoff is 4.38 MCM which forms 5.15 % of the annual rainfall.
Table 2: Calculation of direct runoff for Wadi Shu’eib catchment area using Curve Number method
| Water | Date of | Storm Amount(mm) | Aver Storm | Daily | Ann Runoff | Ann. Rain | Runoff | ||||
| Year | Storms | Salt (0.297) | Hummar (0.135) | W. Shu’eib (0.352) | Ira (0.043) | Shuna South (0.173) | (mm) | Runoff(mm) | (mm) | (mm) | Coef. (%) |
| 2001/2002 | 4-5/Dec. | 104.6 | 117.0 | 77.0 | 50.0 | 46.7 | 84.2 | 11.5313 | |||
| 5-10/Jan. | 170.5 | 161.4 | 75.3 | 66.0 | 47.3 | 99.4 | 18.2796 | ||||
| 20-22/Jan. | 78.5 | 80.0 | 40.7 | 34.0 | 24.7 | 49.6 | 1.3364 | ||||
| 10-13/Feb. | 90.5 | 59.0 | 70.3 | 40.0 | 33.8 | 61.4 | 3.8611 | 35.60 | 563.40 | 6.32 | |
| 20-21/Mar | 36.0 | 34.5 | 35.9 | 20.0 | 4.3 | 27.2 | 0.2708 | ||||
| 27-30/Mar. | 48.5 | 59.1 | 45.8 | 38.0 | 14.6 | 40.8 | 0.2729 | ||||
| 2-4/Apr. | 34.0 | 33.9 | 38.4 | 16.0 | 24.3 | 31.2 | 0.0440 | ||||
| 2002/2003 | 11-13/Dec. | 80.0 | 71.0 | 58.8 | 51.0 | 39.3 | 63.0 | 4.2862 | |||
| 16-21/Dec. | 139.3 | 112.0 | 46.9 | 40.0 | 37.8 | 81.3 | 10.3644 | ||||
| 19-23/Jan. | 51.2 | 41.7 | 37.9 | 39.0 | 26.2 | 40.4 | 0.2418 | ||||
| 9-16/Feb. | 62.2 | 55.5 | 44.1 | 38.0 | 16.4 | 46.0 | 0.8062 | 23.69 | 460.20 | 5.15 | |
| 19-20/Feb. | 46.0 | 46.4 | 18.6 | 15.0 | 27.6 | 31.9 | 0.0233 | ||||
| 23-28/Feb. | 83.8 | 72.5 | 66.6 | 48.0 | 10.0 | 61.9 | 3.9855 | ||||
| 19-22/Mar. | 85.0 | 72.7 | 50.6 | 22.5 | 15.2 | 56.5 | 2.6616 | ||||
| 25-26/Mar. | 67.0 | 55.2 | 44.4 | 31.0 | 30.0 | 49.5 | 1.3219 | ||||
| 2006/2007 | 26-27/Dec. | 95.3 | 77.0 | 73.0 | 20.0 | 4.5 | 66.0 | 5.1353 | |||
| 2-5/Jan. | 51.1 | 54.0 | 41.0 | 27.0 | 19.3 | 41.4 | 0.3208 | ||||
| 19-21/Jan. | 78.0 | 67.0 | 65.0 | 25.0 | 24.6 | 60.4 | 3.6001 | 12.43 | 322.80 | 3.85 | |
| 3-6/Feb. | 66.5 | 74.5 | 45.0 | 39.0 | 38.0 | 53.9 | 2.1193 | ||||
| 13-14/March | 72.0 | 57.0 | 36.0 | 18.0 | 14.6 | 45.1 | 0.6930 | ||||
| 17-Mar | 58.0 | 50.0 | 46.0 | 30.0 | 14.2 | 43.9 | 0.5629 | ||||
According to this calculation the heaviest floods occur between November and March and no significant floods occur in October and May. After that, the evaporation for wet, normal and dry condition was calculated using Turc formula and the results of these calculations are shown in table 2. The calculated long term evaporation rates ranges between 75 % at Salt station, and more than 90 % at Shuna South station.
The “Water Budget Approach” was used to calculate the annual recharge in the study area. The only measured parameter in this approach is the rainfall; evaporation and runoff were calculated using Turc and SCS Curve Number method respectively. Then, the infiltration rate was solved for wet, dry and normal conditions.
Under the assumption that the evapotranspiration is calculated adequately, as well as, the runoff and the initial abstractions are properly determined, then the following water balance equation [10] can be established as:
∆S =P – (R + E) ± Ia
Where:
∆S: the change of groundwater storage or recharge (mm).
P: the precipitation in (mm).
E: evapotranspiration in (mm).
R: runoff in (mm)
Ia: initial abstraction in (mm).
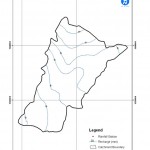
The calculated amount of recharge which will be used in DRASTIC Model for the whole studied area was about 52 mm which forms about 11.13 % of the total rainfall. The recharge rates ranged between 9.6 % at Shuna South station and 12.20 % at Hummar station. The results of recharge calculations for the main stations in the study area are shown in table 3. The distribution of the net recharge in the whole catchment area is presented in figure 4.
Table 3: Direct Recharge for the Whole W. Shu’eib Catchment Area and the Main Rainfall Stations.
| Station Name | Annual
Rainfall (mm) |
Annual
Runoff (mm) |
Annual
Evaporation (mm) |
Annual
Recharge (mm) |
Runoff
Rate (%) |
Evaporation
Rate (%) |
Recharge
Rate (%) |
| Salt | 664.00 | 85.46 | 504.18 | 74.37 | 12.87 | 75.93 | 11.20 |
| Hummar | 476.40 | 51.83 | 366.45 | 58.12 | 10.88 | 76.92 | 12.20 |
| Wadi Shu’eib | 424.20 | 12.22 | 363.20 | 48.78 | 2.88 | 85.62 | 11.50 |
| Ira | 324.50 | 3.18 | 287.57 | 33.75 | 0.98 | 88.62 | 10.40 |
| Shuna South | 204.70 | 0.28 | 184.76 | 19.65 | 0.14 | 90.26 | 9.60 |
| Whole Catchment | 460.207 | 36.87 | 371.39 | 51.96 | 6.37 | 82.50 | 11.13 |
 |
Figure 4: Net Recharge Distribution in Wadi Shu’eib Catchment Area.
|
Reference
- MWI, Ministry of Water and Irrigation, 2007.Water Budget of Jordan, unpublished report.
- Agrar and Hydrotecknik and GTZ, 1997. National Water Master Plan of Jordan, 8 Vol.,Essen, Hannover.
- Abed, A. (2000). Geology of Jordan, its environment and waters, Jordanian Geologist Association, Amman ,Jordan.
- Salem, H.S., (1984). Hydrology and Hydrogeology of the area north of Zerqa River-,MSc. Thesis. University of Jordan, Amman.
- Salameh, E., (1980). The Sweileh Structure N.J.B Geol., Paleont., Mh.., 7. pp. 428-438. Stuttgart, Germany.
- Rimawi, B., 1985. Hydrochemistry and Isotope Hydrology of the Groundwater and Surface Water in N-E of Mafraq, Dhuleil- Halabat Azraq Basin. PhD, Dissertation, Tech. University, Munich, Germany.
- Jain, M.K., Mishra, S.K., Babu, P.S., Venugopal, K. and Singh, V.P. (2006). An enhanced runoff curve number model incorporating storm duration and a non-linear Ia-S relation. J. Hydrologic Engineering, ASCE, Vol. 11, No. 6, pp. 631-635.
- Gavilan, P., Berengena, J., and Allen, R.G (2007). “Measuring versus estimating net radiation and soil heat flux: Impact on Penman – Monteith reference ET estimates in semiarid regions.” Agricultural Water Management 89, 275-286.
- Gupta, B., 1979. Water Resources Engineering and Hydrology. First Edition, Ghowhan Printing Service, New Delhi, India.
- Dingman, S.L., 2002: Physical Hydrology, 2nd Edition: Upper Saddle River, New Jersey. Prentice Hall.

This work is licensed under a Creative Commons Attribution 4.0 International License.


