How to Cite | Publication History | PlumX Article Matrix
Phylogenetic Assessment of Garcinia Species Using RAPD Markers
Madappa Machamada Bheemaiah1 , Bopaiah Ajikuttira Kushalappa2 and Grace Prabhakar3
1Development Centre, Bharathiar University, Coimbatore, 641 046, Tamil Nadu, India.
2Department of Botany, St. Joseph’s College (Autonomous), No 36, Lalbagh Road, Shanthinagar, Bengaluru, 560027, Karnataka, India.
3Department of Biotechnology, St. Joseph’s College (Autonomous), No 36, Lalbagh Road, Shanthinagar, Bengaluru, 560027, Karnataka, India.
Corresponding Author E-mail: madappa@sjc.ac.in
DOI : http://dx.doi.org/10.13005/bbra/2706
ABSTRACT: The plants in the Garcinia species are economically important. Phylogenetic investigation is needed for these tree species to boost breeding and conservation programmes. Six Garcinia species were investigated for their phylogenetic relationship using Random Amplified Polymorphic DNA(RAPD) markers. A standardised procedure was developed for isolation of DNA from the leaf samples of G. cambogia, G. indica, G. xanthochymus, G. morella, G. mangostana and G. livingstonei. Phylogenetic investigation is needed for these tree species to boost breeding and conservation programmes. A standardised procedure was developed for isolation of DNA from the leaf samples of G. cambogia, G. indica, G. xanthochymus, G. morella, G. mangostana and G. livingstonei. The DNA samples were subjected to PCR using 8 random primers. 269 polymorphic bands were obtained and scored to develop the values for the genetic distance. The dendrogram was developed using the software dendroUPGMA and the Cophenetic correlation coefficient of 0.801 is obtained. G. cambogia and G. livingstonei are closely placed with a score of 24% followed by G. morella. It had a 30% index score to G. cambogia and G. livingstonei but is followed by just 31% score with G. indica. G.mangostana is connected at 33.5% dissimilarity to the above groups showing it is an introduced variety. G. xanthochymus is the last link with 37% score in the matrix. The data represented is the first of the type for the species. This will help in further DNA related work in these species. The genetic relatedness among these species is reported and this can be utilised in marker analysis for other Garcinia species.
KEYWORDS: Garcinia; RAPD; Phylogenetic Analysis
Download this article as:| Copy the following to cite this article: Bheemaiah M. M, Kushalappa B. A, Prabhakar G. Phylogenetic Assessment of Garcinia Species Using RAPD Markers. Biosci Biotech Res Asia 2018;15(4). |
| Copy the following to cite this URL: Bheemaiah M. M, Kushalappa B. A, Prabhakar G. Phylogenetic Assessment of Garcinia Species Using RAPD Markers. Biosci Biotech Res Asia 2018;15(4). Available from: https://www.biotech-asia.org/?p=32124 |
Introduction
Garcinia is a group of plant species comprising of 250 species belonging to family Clusiaceae. The species are well distributed in the Asian continent. The species of Garcinia in India are distributed in the Western Ghats and the North East regions. Of the 30-35 species reported in India from the Western Ghats, few are endemic in nature.1 The endemic varieties are mostly trees and are very important plant species of the forests.2 Cultivation of a few species is seen in Kerala and Karnataka states. These trees contain fruits that are utilised for the economical and pharmacological properties. Garcinia cambogia (Gaertn.)Desr., Garcinia indica (Thouars) Choisy, Garcinia xanthochymus Hook. f. ex J.Anders, Garcinia morella (Gaertn.)Desr, Garcinia mangostana L. and Garcinia livingstonei T. Anderson are the common varieties that are seen distributed in these regions. Garcinia mangostana is an introduced variety from the Indonesian region.3 Garcinia cambogia (G. gummi-gutta L. Roxb.) are medium sized trees and the fruits are used to extract Hydroxycitric acid (HCA). HCA is used in anti-obese drug formulations.4 The fruits from Garcinia indica, also a medium sized tree is used in culinary, cosmetics and pharmaceutical formulations.5 Garcinia xanthochymus twigs contains important phenolic compounds used in anti-cancer treatment.6 Garcinia morella is utilised for a phytochemical: morellin.7 Garcinia mangostana was introduced in India for its importance as an edible fruit.8 Garcinia livingstonei fruits contain bioflavonoids that are used in treatment for colon cancer in humans.9
Randomly Amplified Polymorphic DNA (RAPD) markers are PCR-based markers that amplify random regions on DNA segments. The primers used are short, the techniques are fast, and it uses very less DNA as template. There is no prior knowledge needed of the sequences from these species.10 PCR involves a procedure to amplify specific segments of DNA. A combination of RAPD primers in PCR help us to get amplified DNA segments from the plant template DNA provided for the investigation. The plants in the Garcinia genus of late has been investigated in isolated populations for their phylogenetic relationships ISSR analysis in G. mangostana in Sumatra region has been established.11 The molecular data is used to validate endemicity of varieties and to rule out possible introductions in the past. Phylogenetic analysis among the species can help researchers understand evolutionary pathways of genes, genomes and species by utilizing genetic differences.
There are different varieties of Garcinia cambogia being cultivated in different regions.12 Breeding programs have been initiated in various areas.13 Selection based on morphological data is tedious and time taking. Several attempts have been made to identify and develop SCAR based markers for sex determination and plant identification.14
The objective of the present investigation was to identify genetic relationship among the six species using RAPD markers. Polymorphism data was analysed and genetic relatedness among the six species was recorded. DNA extraction and PCR protocols have been standardised for Garcinia indica and this procedure can be adapted to tree species.15 The standardisation of DNA extraction, PCR protocols, ISSR and RAPD marker analysis in other Garcinia species is also investigated.16 No genetic relatedness is derived out of the investigation. Genetic diversity in eight Garcinia cambogia genotypes was analysed by PCR-RAPD method and genetic relatedness and diversity has been recorded.17 Genetic diversity relates to understanding the species ability to adapt to the environment.18 The molecular data is limited and an attempt to develop a relationship study among the species is made. In the present investigation bands obtained from the PCR-RAPD gels were scored and a dendrogram constructed based on the unweighted pair group method with arithmetic mean (UPGMA) clustering method is developed. The molecular data is limited and an attempt to develop a relationship study among the species is made. The result will add on to the molecular data of these tree species. A Cophenetic Correlation can be obtained for these species and the report on its closeness in cluster form RAPD markers can be established. This data will support the phenotypic relatedness among species.
Material and Methods
Collection of Leaf Samples
The trees of G. cambogia, G. indica, G. xanthochymus, G. morella, G. mangostana and G. livingstonei used in the study were located and the GPS coordinates of the collection spots are recorded in Table 1. The collection areas recorded are from sites which are close to each other. The collection herbarium is recorded at the department of Biotechnology, St. Joseph’s college, Bangalore. Leaf samples were collected and stored in liquid nitrogen.
Table 1: GPS coordinates of plant specimens.
| Plant species | GPS coordinates | |
| Garcinia cambogia | 12°05’26.0″N | 76°02’03.1″E |
| Garcinia indica | 12°05’30.8″N | 76°01’59.3″E |
| Garcinia xanthochymus | 12°05’33.0″N | 76°01’48.5″E |
| Garcinia morella | 11°59’41.5″N | 76°04’01.9″E |
| Garcinia mangostana | 11059’40.2″N | 76°04’02.6″E |
| Garcinia livingstonei | 12°05’24.9″N | 76°01’56.5″E |
DNA Extraction
500 mg of the leaf sample were homogenised using tissue homogenizer with 15ml of lysis buffer consisting of 2% Hexadecyltrimethylammonium bromide (CTAB), 100mM Tris pH 8, 20mM EDTA, 1.4M NaCl, 2% polyvinylpyrrolidone 40 (PVP) and 0.2% Beta-mercaptoethanol. The extract was transferred to a tube and were incubated at 65°C for 1 hour in a water bath. A set of six tubes with the six species was obtained. The tubes are Centrifuged at 10000 rpm for 10 minutes. Supernatant was transferred to a fresh tube.12ml is recovered from the supernatant. Equal volume of Chloroform was added, and the tubes are mixed. The tubes are than centrifuged at 10000 rpm for 15 minutes. The aqueous layer is pipetted out into fresh centrifuge tube without disturbing the interface. Equal volume of Isopropanol and 2 ml of 3M Sodium acetate was added. The contents with the tube are kept at room temperature for 10 minutes. The tube is than centrifuged at 10000 rpm for 15 minutes. The supernatant was discarded. The pellet was washed with 600µl of 75% ethanol. The pellet air dried and stored in 600µl of 1X Tris- EDTA buffer. The method was used to extract the DNA from all the six species of Garcinia leaf samples.
Column Purification
Plant genomic purification kit, with the catalogue no 2115700021730 from Genei laboratories, Bangalore India was used to purify the extracted DNA samples. The quality of isolated genomic DNA was checked by Agarose gel electrophoresis. 2µl of DNA was mixed with 1µl of 1X loading dye and loaded in a slot of 0.8% agarose gel containing 0.015 µg/ml of Ethidium Bromide. The purified samples were subjected to RAPD-PCR reactions.
PCR-RAPD Analysis
The PCR reaction was set with the components detailed in table 2. 37µl of this reaction mixture was aliquoted into 48 different labeled PCR vials and to this 2µl of different template DNA and 1µl random primer were added. The details of the eight RAPD primers used is detailed in table 3. The PCR was set in Eppendorf Mastercycler Gradient unit with reaction conditions detailed in table 4. After the reaction the components in the vail were loaded on agarose gels.
Table 2: PCR Reaction Components.
| Components | Master mix | |
| 1X | 48X | |
| D.D.H20 | 17ul | 816ul |
| 2X PCR Master MIX | 20 µl | 960µl |
| Random Primer | 1µl | 48µl |
| Template DNA | 2ul | 96ul |
| Total Volume | 40 µl | 1920µl |
Table 3: List of RAPD Primer with Sequence Details.
| Sl.no | Primers | sequence |
| 1. | OPA-02 | TGCCGAGCTG |
| 2. | OPB-10 | CTGCTGGGAC |
| 3. | OPD-02 | GGACCCAACC |
| 4. | OPC-06 | GAACGGACTC |
| 5. | OPD-08 | GTGTGCCCCA |
| 6. | OPC-07 | GTCCCGACGA |
| 7. | OPB-07 | GGTGACGCAG |
| 8. | OPB-08 | GTCCACACGG |
Table 4: PCR Cycle Conditions.
| Temperature | Time | No. of cycles |
| 94˚C | 5 minutes | 1 |
| 94˚C | 30 second |
40 |
| 45˚C | 1 minute | |
| 72˚C | 1.30 minute | |
| 72˚C | 7 minutes | 1 |
| 4˚C | Till loading |
Detection by Agarose Gel Electrophoresis
The RAPD-PCR products were separated based on their molecular weight, by agarose gel electrophoresis. 1.2% agarose gel with 0.015 µg/ml of Ethidium Bromide were used. The DNA were run using electrophoresis buffer and in electrophoresis units and observed under gel documentation units. DNA ladder 100 bp was used as molecular size marker. The gel was documented in Gel documentation unit and photographs of gels displaying the bands were taken for data analysis.
Data Analysis
Each amplified product from the gel was scored as a unit character and the populations were recorded for the presence (1) or absence (0) of a band. By using the concept of calculating all possible pair-wise genetic distances, the values were obtained from the following formula: Dab = 1−(2nab/(na+nb)), Where, na and nb are the numbers of bands amplified in individuals a and b respectively and 2nab is the number of bands shared by those individuals.19,20,21 The percent disagreement between the populations was calculated based on Unweighted Pair Group Method with Arithmetic Mean (UPGMA). The resulting dissimilarity index was used to evaluate the relationship among various populations of this species with cluster analysis, using Unweighted pair-group average. All computations were carried out using the phylogenetic software, DendroUPGMA.22,23
Result and Discussion
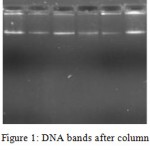
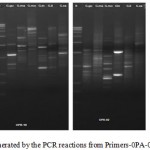
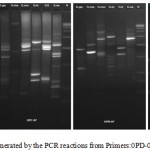
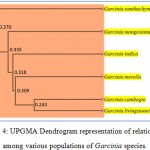
The DNA was successfully extracted from all the six Garcinia species. The extracted DNA samples were column purified and checked on agarose gel (Figure 1). RAPD amplicons were resolved on agarose gels (Figure 2,3). A total of 271 bands were obtained and scored from 8 primers of which, 269 were polymorphic (Table 5). The results showed 98% polymorphic bands for the primer OPD-02 and 100% for the other primers. The only monomorphic band was of 2.4kb and was obtained from the OPD-02 primer having a sequence GGACCCAACC. The scoring data from the bands were analysed for the values for pair wise distance matrix calculation. The generated values are reported in a distance matrix format in Table 6. From the values of the distance matrix, the software DendroUPGMA generated the dendrogram as represented in Figure 4. The dendrogram is also represented in Newick format,a way of representing dendrograms as a text, using parentheses and commas.24 All the tree-visualization programs accept this format. The Newick representation for the dendrogram obtained is:(((((Ca:0.243,li:0.243):0.067,mo:0.309):0.009 ,in:0.318):0.017,ma:0.335) :0.034,xa:0.370). The Cophenetic correlation coefficient (CP) from the data of RAPD scoring for was found to be 0.80. The CP value for this dendrogram is a measure of how faithfully a dendrogram preserves the pairwise distances between the original unmodeled data points. It is a value between 0 and 1, where 1 represents a perfect match in the dendrogram representation.25 The value here is at 80% and is a good score for a dendrogram. The dendrogram in figure 4 indicates that the species are divided into 2 clusters: one that is solely G. xanthochymus and all other species in the other cluster with a genetic distance of 37%. Within the cluster with all other species, G. cambogia and G. livingstonei are most similar to each other with a 24% dissimilarity index. Both the species produce hydroxy citric acid and guttiferones as their main chemical component in fruits.26,27 This is an indictator for the phenotypic relation. G. morella and G. indica have a 30% and 31% dissimilarity index to both G. cambogia and G livingstonei respectively. Both the plants have bright red fruits and are phenotypically similar. This is attributed to the presence of anthocyanin pigments in them. The oil from both the plants are utilised in cosmetic industries.28 G. mangostana is the least similar in the group with a dissimilarity index of 33.5% in the group. This variety is introduced to India and the dendrogram justifies the same. The research on the origin of the Malaysian varieties of G. mangostana says this species may be the first in origins among the Garcinia varieties.29
G. xanthochymus is the most dissimilar with a score of 37% and is placed by itself in the dendrogram. The phenotypic characters of this plant are very different to the group in terms of fruit and leaf size. The chemical composition of these fruits is exclusive and includes xanthochymols.30 The dendrogram representation outlines the relationships between and among these plant species. G. cambogia and G. livingstonei are closely related. G. morella. G. indica follows the cluster in relationship. Similar relation is corelated in the species of watermelons and disease resistance varieties is grouped together.31 In the current investigation the species of Garcinia is grouped together with relation to its phenotypic correlation. Chemical constituents and morphological characters are taken into consideration. The primers utilised in the study can be used to analyse the relationship among clones in species. Similar work has been established in Popular and willow clones.32 The study justifies G. xanthochymus is least similar to the group and is represented by the fact its phenotypically different in characters. The genetic distances can be correlated with the phenotype and this is the first reference towards the species in Garcinia.
Table 5: Percentage Polymorphism of Primers.
| Primers | No of bands -A | No of polymorphic bands -B | % polymorphism B/A x 100 |
| OPA-02 | 21 | 21 | 100 |
| OPB-10 | 29 | 29 | 100 |
| OPD-02 | 50 | 49 | 98 |
| OPC-06 | 31 | 31 | 100 |
| OPD-08 | 28 | 28 | 100 |
| OPC-07 | 49 | 49 | 100 |
| OPB-07 | 26 | 26 | 100 |
| OPB-08 | 37 | 37 | 100 |
Table 6: Representation data of distance matrix obtained by pair wise distance values.
| G.cambogia | G.mangostana | G.morella | G.indica | G.livingstonei | G.xanthochymus | |
| G.cambogia | 0 | 0.763 | 0.662 | 0.65 | 0.486 | 0.794 |
| G.mangostana | 0 | 0.653 | 0.663 | 0.603 | 0.714 | |
| G.morella | 0 | 0.670 | 0.576 | 0.820 | ||
| G.indica | 0 | 0.59 | 0.695 | |||
| G.livingstonei | 0 | 0.674 | ||||
| G.xanthochymus | 0 |
 |
Figure 1: DNA bands after column purification. |
 |
Figure 2: RAPD profile generated by the PCR reactions from Primer s-0PA-02; OPB-10;OPD-2;OPC-6. |
 |
Figure 3: RAPD profile generated by the PCR reactions from Primers:0PD-08; OPC-7; OPB-7; OPB-8. |
 |
Figure 4: UPGMA Dendrogram representation of relationship among various populations of Garcinia species. |
Conclusion
The genetic distances derived among the species have suggested a preliminary relationship data among Garcinia. The CP value validates the accuracy of the analysis. With 98% of polymorphism in these markers, the sequences of the primers can be utilised for generating specific markers for future work. Genetic diversity study has shown relatedness to the phenotypic characterisation. The species being economically important, further investigation at the marker level can boost breeding and conservation programmes of these tree species. This research can be expanded to plausible gene tags for these species. The genetic diversity studies can be expanded to the Garcinia varieties in India.
Acknowledgments
The authors wish to acknowledge the financial support for the research work from the University grant commission under the minor research grant for college teachers.
Funding Sources
The work has been funded by the University Grant Commission under the minor research project grant.
References
- Maheshwari J. K. Taxonomic studies on Indian Guttiferae III. The genus Garcinia Linn. Sensulato. Bull. Bot. Sur. India. 1964;6:107-135.
- Utpala P., Babu K. N., Kumar R. S., Ashis G. R., Mohan S., Parthasarathy V. A. Diversity of Indian Garcinia – A medicinally important spice crop in India. Acta Horticulturae. 2013;979:467-476.
- Morton J (ed). Mangosteen. Fruits of warm climates, Miami, Julia F. Morton. 1987;301–304.
- Kuriyan K. I., Pandya K. C. A note on the main constituents of the dried rind of the fruit of Garcinia cambogia. J. Indian Chem. Soc. 1931;81:469-472.
- Reddy S. Y., Prabhakar J. V. Cocoa butter extenders from kokum (Garcinia indica) and phulwara (Madhuca butyracea) butter. J Am. Oil Chem. Soc. 1994;7:217-219.
CrossRef - Han Q., Qiao C., Song J., Yang N., Cao X., Peng Y., Yang D., Chen S., Xu H. Cytotoxic prenylated phenolic compounds from the twig bark of Garcinia xanthochymus. Chemistry and Biodiversity. 2007;4:940-946.
CrossRef - Rao B. S. Morellin, a constituent of the seeds of Garcinia morella. J.Chem.Soc. 1937;853-854.
CrossRef - Li G., Thomas S., Johnson J. J. Polyphenols from the mangosteen (Garcinia mangostana) fruit for breast and prostate cancer. Frontiers in Pharmacology. 2013;4:80-84.
CrossRef - Yang H., Figueroa M., To S., Baggett S., Jiang B., Basile J. M., Weinstein I. B., Kennelly J. E. Benzophenones and bioflavonoids from Garcinia livingstonei fruits. Journal of agriculture and food chemistry. 2010;58(8):4749–4755.
CrossRef - Kiss G. B., Osanandi G., Kalman K., Kalo P., Okresz L. Construction of basic linkage map of alfa alfa using RFLP, RAPD, isozyme and morphological markers. Mol Gen Genet. 1993;20:1717-1720.
- Ellina M., Sobir., Edi S., Roedhy P. Assessment of inter simple sequence repeat (ISSR) technique in mangosteen (Garcinia mangostana L.) grown in different Sumatra region. Journal of Horticulture and Forestry. 2010;2:127-134.
- Tharachand C., Immanuel Selvaraj C., Abraham Z. Molecular insights into the genetic diversity of Garcinia cambogia germplasm accessions. Braz. arch. biol. technol. 2015;58(5):765-772.
CrossRef - Abraham Z.,Surendra M., Rao G. E., Narayanan S. L., Biju S. Collection and characterisation of malabar tamarind [Garcinia cambogia (Gaertn.) Desr.]. Genetic resources and crop evolution. 2006;53:401-406.
CrossRef - Joseph K. S., Murthy H. N., Ravishankar K. V. Development of male-specific SCAR marker in Garcinia morella (Gaertn.) Desr. J.Genet. 2014;93:875–878.
CrossRef - Sahasrabudhe A., Deodhar M. Standardisation of DNA extraction and optimization of RAPD-PCR conditions in Garcinia indica. International journal of Botany. 2010;6:293-298.
CrossRef - Jayesh A., Vikas J.,Nitin D. Optimization of DNA extraction methods from Garcinia species for ISSR-PCR, RAPD-PCR and DNA barcoding. Asian journal of Biotechnology. 2016;9:35-42.
CrossRef - Santosh P., Arakera B. S. Genetic diversity analysis of endemic species, Garcinia cambogia (Gaertn) using randomly amplified polymorphic DNA markers. Research in Pharmacy. 2017;7:01-05.
CrossRef - Tilwari A., Tamrakar K.,Sharma R. Use of random amplified polymorphic DNA (RAPD) for assessing genetic diversity of Ocimum sanctum (Krishna Tulsi) from different environments of Central India. Journal of medicinal plant research. 2013;7(24):1800-1808.
- Garcia V. S.,Pui. P. P. P. DendroUPGMA:A dendrogram construction utility. Retrieved from http://genomes.urv.cat/UPGMA/. 2002. March 01
- Kunimasa Matsumoto, Kouya Shimada, Naoto Horinishi, Katsuji Watanabe. Evaluation of the method based on restriction fragment length polymorphism analysis as simple analysis method of lactic acid bacteria in foods. Food and Nutrition Sciences 2016; Vol.7 (3):163-172
- Levi A., Rowland L.J., Hartung J.S. Production of reliable randomly amplified polymorphic DNA (RAPD) markers from DNA of woody plants. HortScience.1993; 28: 1188–1190.
CrossRef - Santi Garcia Vallve, Pere Puigbo Pere Pui. (2002 March 01) DendroUPGMA:A dendrogram construction utility. Retrieved from http://genomes.urv.cat/UPGMA/
CrossRef - Kirk R. G.,Gibson M. M. H., Richard W. F.,Mckee C. T.,Cardellina H. J., et al (1. The guttiferones, HIV-inhibtory benzophenones from Symphonia globullifera, Garcinia livingstonei, Garcinia ovalifolia and Clusia rosea. Tetrahedron. 1992;48:10093-10102.
CrossRef - Kolodziejczyk J., Masullo M., Olas B., Piacente S., Wachowicz B. Effects of garcinol and guttiferone K isolated from Garcinia cambogia on oxidative/nitrative modifications in blood platelets and plasma. Platelets. 2009;20( 7):487-489.
CrossRef - Nayak A. C., Rastogi K. N., Raghavarao K. S. M. S. Bioactive Constituents Present in Garcinia indica Choisy and its Potential Food Applications: A Review. International Journal of Food Properties. 2010;13(3):441-453.
CrossRef - Nazre M,. New evidence on the origin of mangosteen (Garcinia mangostana L.) based on morphology and ITS sequence. Genet. Resour. Crop Evol. 2014; 61: 1147.
CrossRef - Matsumoto K., Akao Y., Kobayashi E., Ito T., Ohguchi K., Tanaka T., Iinuma M., Nozawa Y. Cytotoxic benzophenone derivatives from Garcinia species display a strong apoptosis-inducing effect against human leukemia cell lines. Biol Pharm Bull. 2003;26(4):569-71.
CrossRef

This work is licensed under a Creative Commons Attribution 4.0 International License.


