Manuscript accepted on : 29 August 2011
Published online on: --
S. Ganguly* and A. K. Banik
Department of Chemical Engineering Biochemical Engineering Division, Biotechnology Laboratory, University of Calcutta, 92, A. P. C. Road, Kolkata - 700 009 India.
Corresponding Author E-mail: subhadeepgangulyphysiol@rediffmail.com
ABSTRACT: An experimental study was carried out to examine the effects of different metabolic inhibitors namely 6-marcaptopurine, 2, 4 dinitrophenol, sodium arsenate, mercuric chlorice, sodium arsenite, 2-thiouracil, sodium azide, malonic acid and sodium fluoride on growth and l-glutamic acid production by the mutant Micrococcus glutamicus AB100. All these inhibitors showed detrimental effect on growth of l-glutamic acid production.
KEYWORDS: Metabolic inhibitors; L-glutamic acid; Growth; Mutant; Micrococcus glutamicus
Download this article as:| Copy the following to cite this article: Ganguly S, Banik A. K. Effect of Metabolic Inhibitors on Growth and Production of L-glutamic Acid by the Mutant Micrococcus glutamicus AB100. Biosci Biotech Res Asia 2011;8(2) |
| Copy the following to cite this URL: Ganguly S, Banik A. K. Effect of Metabolic Inhibitors on Growth and Production of L-glutamic Acid by the Mutant Micrococcus glutamicus AB100. Biosci Biotech Res Asia 2011;8(2). Available from: https://www.biotech-asia.org/?p=9523/ |
Introduction
Microbial production of l-glutamic acid is predominantly operated through Embden-Meyerhof-parnas (EMP) Pathway and the early steps of Kerb’s cycle in presence of oxygen which serves as a terminal electron accepted1. Thus, different metabolic inhibitors may alter the production of l-glutamic acid by inhibiting either the path ways at different steps or the growth of the microorganism as a whole.
The present investigation was under taken to examine the effect of different metabolic inhibitors with different concentrations on growth and l-glutamic acid production by the mutant Micrococcus glutamicus AB100.
Materials and Methods
Microorganism
A biotin-auxotrophic Micrococcus glutamicus AB100, derived from Micrococcus glutamicus AB1, by induced mutation by ethyleneimine as chemical and UV irradiation as physical mutagens respectively2.
Synthetic medium for l-glutamic acid production
The following composition of the synthetic medium was used for l-glutamic acid fermentation by the Micrococcus glutamicus AB100 : glucose, 9.0%; diammonium hydrogen phosphate, 1.4%; magnesium sulfate, hepatahydrate, 0.03%; calcium carbonate, 0.04%; ferrous sulfate heptahydrate, 5.0 µg/ml; Zinc sulfate, hypatahydrate, 1.0 µg/ml; manganese sulfate, tetrahydrate, 1.0 µg/ml; and biotin, 0.2 µg/ml; pH 6.53.
Fermentation conditions
Fermentation was conducted with shake-glask method on a rotary shaker totating at 150 rpm in 10 ml Erlenmyer Conical flask containing 20 ml synthetic medium for 72h at 29oC, inoculated with 4.0% (v/v) of 48 h old seed culture (6.0 X 10⁷ cells) of Micrococcus glutamicus AB1004.
Addition of metabolic inhibitors
Different concentrations (0.100 – 0.001 mole / ml) of different metabolic inhibitors were added to the fermentation broth one by one at different time intervals (0 – 48h) to examine their effects on growth and l-glutamic acid production.
Analysis of amino acid
Chlorimetric estimation method using descending chromatography was employed for the estimation of l-glutamic acid5,6.
Estimation of Dry cell weight (DCW)
DCW was estimated using the method of Shah et al7.
Statistical Analysis
Values were expressed as mean ± SEM, where n=6. The data were statistically estimated by one way ANOVA followed by Dunett’s post hoc. Multiple comparison test using “prism 4.0” soft ware (Graph pad Inc., USA). A ”p” value less than 0.05 was considered significant an less than 0.01 as highly significant.
Result and Discussion
The effects of different metabolic inhibitors namely 6-marcaptopurine, 2, 4 dinitrophenol, sodium arsenate, mercuric chloride, sodium arsenite, 2-thiouracil, sodium azide, malonic acid and sodium fluoride were examined on growth and l-glutamic acid production by the mutant Micrococcus glutamicus AB100 as depicted in Fig. 1 – 9 as follows :
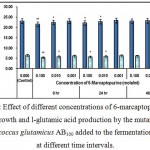 |
Figure 1: Effect of different concentrations of 6-marcaptopurine on growth and l-glutamic acid production by the mutant Micrococcus glutamicus AB100 added to the fermentation broth at different time intervals. |
(Values were expressed as mean ± SEM, where n = 6; *p < 0.05, **p < 0.01 when compared to control).
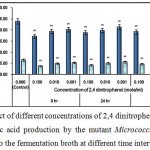 |
Figure 2 : Effect of different concentrations of 2,4 dinitrophenol on growth and l-glutamic acid production by the mutant Micrococcus glutamicus AB100 added to the fermentation broth at different time intervals. |
(Values were expressed as mean ± SEM, where n = 6; *p < 0.05, **p < 0.01 when compared to control).
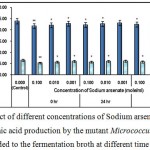 |
Figure 3 : Effect of different concentrations of Sodium arsenate on growth and l-glutamic acid production by the mutant Micrococcus glutamicus AB100 added to the fermentation broth at different time intervals. |
(Values were expressed as mean ± SEM, where n = 6; *p < 0.05, **p < 0.01 when compared to control).
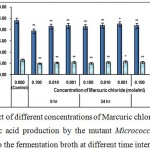 |
Figure 4 : Effect of different concentrations of Marcuric chloride on growth and l-glutamic acid production by the mutant Micrococcus glutamicus AB100 added to the fermentation broth at different time intervals. |
(Values were expressed as mean ± SEM, where n = 6; *p < 0.05, **p < 0.01 when compared to control).
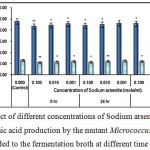 |
Figure 5 : Effect of different concentrations of Sodium arsenite on growth and l-glutamic acid production by the mutant Micrococcus glutamicus AB100 added to the fermentation broth at different time intervals. |
(Values were expressed as mean ± SEM, where n = 6; *p < 0.05, **p < 0.01 when compared to control).
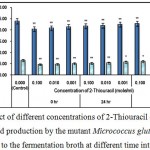 |
Figure 6 : Effect of different concentrations of 2-Thiouracil on growth and l-glutamic acid production by the mutant Micrococcus glutamicus AB100 added to the fermentation broth at different time intervals. |
(Values were expressed as mean ± SEM, where n = 6; *p < 0.05, **p < 0.01 when compared to control).
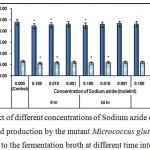 |
Figure 7 : Effect of different concentrations of Sodium azide on growth and l-glutamic acid production by the mutant Micrococcus glutamicus AB100 added to the fermentation broth at different time intervals. |
(Values were expressed as mean ± SEM, where n = 6; *p < 0.05, when compared to control).
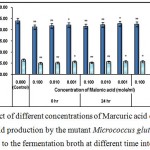 |
Figure 8 : Effect of different concentrations of Marcuric acid on growth and l-glutamic acid production by the mutant Micrococcus glutamicus AB100 added to the fermentation broth at different time intervals. |
(Values were expressed as mean ± SEM, where n = 6; *p < 0.05, **p < 0.01 when compared to control).
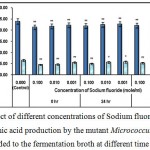 |
Figure 9 : Effect of different concentrations of Sodium fluoride on growth and l-glutamic acid production by the mutant Micrococcus glutamicus AB100 added to the fermentation broth at different time intervals. |
(Values were expressed as mean ± SEM, where n = 6; *p < 0.05, **p < 0.01 when compared to control).
All these metabolic inhibitors showed either significantly negative impacts on growth and l-glutamic acid production (p < 0.05 and p < 0.01) or no significant effects.
6 – mercaptopurine being a thiopurine exerted its detrimental effects on cellular growth and l-glutamic acid production probably developing multiple cytotoxicities8.
2, 4 dinitrophenol, is a cellular metabolic poison which uncouples oxidative phosphorylation, leading to rapid utilization of ATP without further generation of ATP, leading to impairement of cellular metabolism9.
The toxic effect of sodium arsenate was recorded on cellular growth and l-glutamic acid production probably due to the fact that the arsenate can replace the inorganic phosphate in the step of glycolysis that generated 1, 3 bisphosphoglycerate, producing 1–arseno–3–phosphoglycerate. This compound is hydrolyzed immediately without generation of ATP, leading the cytotoxicity10.
Mercuric chloride exerted its lethal effect on growth and l-glutamic acid production probably via blocking different degenerative metabolic pathways. However its exact mechanism of developing cytotoxicity is still not clear to us.
Due to multiple cytotoxic effects of sodium arsenite it might adversely affected the growth and l-glutamic acid production by the mutant Micrococcus glutamicus AB10010.
2-thiouracil may generate the toxic effects probably by enhancing the DNA stand breaking12.
Sodium azide is a bacteriostatic compound which inhibits cytochrome oxidase in different Gram +ve and Gram –ve bacteria and thus may inhibit l-glutamic acid production13.
L-glutamic acid production was inhibited by malonic acid which probably inhibited succinic dehydrogenase (Complex II) in the respiratory electron transport chain14.
Similar to most soluble meterials, fluoride compounds like sodium fluoride are readily absorbed by different organisms and thereafter it binds calcium and interferes with the activities of various enzymes15. In the present study it might inhibit the bacterial growth and l-glutamic acid production by this method.
References
- Amin G and Talhi – A1 A. Production of L-glutamic acid by Immobilized Cell Reactor of Bacterium Corynebacterium glutamicum Entrapped into Carrageenan Gel Beds. World Appl. Sci. J 2007; 2(1) : 62-67.
- Ganguly S and Banik A. K. Induced mutation and selection of High Yielding strain of Micrococcus glutamicus for glutamic acid production. J. Indian Chem. SOC 2010; 87(6) : 717 – 721.
- Ganguly S and Banik A. K. Role of trace elements on the production of l-glutamic acid by a mutant Micrococcus glutamicus AB100. J. Indian Chem. SOC 2011; 88(5) : 707 – 710.
- Ganguly S and Banik A. K. Optimization of physical conditions for the production of l-glutamic acid by a mutant Micrococcus glutamicus AB100. Int. J. Pharm. Biol. Sci 2011; 2(2) : 295 – 299.
- Chinard F P. Photomeric estimation of proline and ornithine. J. Biol. Chem 1952; 199 : 91 – 95.
- Spies J R. Colorimetric procedure for amino acids. Methods in Enzymol 1957, 3 : 468 – 471.
- Shah A H, Hameed A, Ahmad S and Khan G M. Optimization of culture conditions for l-lysine Fermentation by Corynebacterium glutamicum. On line J. Biol. Sci 2002; 2(3) : 151 – 156.
- Sahasranaman S, Howard D and Roy S. Chinical pharmacology and pharmacogenetics of thiopurines. Eur. J. Chin. Pharmacol 2008; 64(8) : 753 – 567.
- Cutting W C, Mehrtens H G and Tainter M L. Action and uses of dinitrophenil : Promising metabolic applications. J. Am. Med. Assoc 1933; 101 : 193 – 195.
- Silver S, Phung L. T. Novel expansion of living chemistry or just a serious mistake? FEMS Microbiol. Letts. 2011; 315 : 79-80.
- Freeman M H, Shupe T F, Vlosky R P and Barnes H M. Past, present and future of the wood preservation industry. Fores products J 2003; 53(10) : 8 – 15.
- Green U C and Kethkar M. The influence of diazepam and thiouracil upon the carcinogenic effect of diethylnitrosamine in gerbils. Z. Krebsforsch 1978; 92 : 55-62.
- Eric A and Betterton, Environmental Fate of sodium Azide derived from Automobile Airbags. Critical Rev. Environ. Sci. Technol 2003; 33(4) : 423 – 458.
- Lewis R. J. Toxicological effects of Malonic acid in Sax’s Dangerous properties of Industrical Materials. Wiley J and Sons Inc. (eds.). vol. 3, New York, pp. 3248 (1999).
- Bradford D, Gessner, Beller M, Middangh J. P. and Whitford g. M. Acute fluoride poisoning from a public water system. New Eng. J. Med 1994; 330(2) : 95-99.

This work is licensed under a Creative Commons Attribution 4.0 International License.


