How to Cite | Publication History | PlumX Article Matrix
Using Artificial Neural Networks for Analyzing Efficiency of Advanced Recovery Methods
Irik Galikhanovich Fattakhov, Ramzis Rakhimovich Kadyrov, Ildar Danilovich Nabiullin, Ramis Rasilevich Sakhibgaraev, Anatolij Nikolaevich Fokin
FSBEI of “Ufa State Petroleum Technological University” 1, Kosmonavtov Street, Ufa, 450062, Republic of Bashkortostan, FSBEI of Ufa State Petroleum Technological University”, Oktyabrsky branch, 54à, Devon Street, Oktyabrsky, 452607, Republic of Bashkortostan
ABSTRACT: A method of using neural networks for analyzing efficiency of advanced recovery methods has been proposed. In the course of creating a model of artificial neural networks, optimal parameters of the network for training on an array of data by the layers of Solonets deposit have been defined. The architecture of multilayer Rosenblatt's perceptron has been disclosed. Its optimal parameters for solving the task have been justified. It has been proven that the productivity coefficients calculated in this way are most approximated to the actual values.
KEYWORDS: Artificial neural network; advanced recovery method; Rosenblatt's perceptron; productivity coefficient; geological; technical measures
Download this article as:| Copy the following to cite this article: Fattakhov I. G, Kadyrov R. R, Nabiullin I. D, Sakhibgaraev R. R, Fokin A. N. Using Artificial Neural Networks for Analyzing Efficiency of Advanced Recovery Methods. Biosci Biotechnol Res Asia 2015;12(2) |
Introduction
Analysis of advanced recovery methods (ARM) is the most important task in developing an oil deposit. Today, the main part of the geological and technical measures (GTM) is the processing of the bottom holes, particularly in carbonate formations. Their calculation is associated with great difficulty, due to the absence of mathematical models for accounting for factors of a real deposit, which influence the productivity of the well,for example, precipitation of organic salts, asphalt, resin, and paraffin deposits, complex structure of the collecting pipe. Therefore, a new approach to calculating efficiency of advanced recovery methods is required, which would make it possible to take into account properties of a real oil formation [1].
In general, efficiency of the analysis of advanced recovery methods may be divided into the following stages:
- calculation of increasing the well productivity coefficient after using ARM,
- calculation of water content and defining further dynamics of oil recovery.
In the first stage, an instant boost in the well productivity coefficient occurs. This can be achieved by using various models of radial inflow into the well. In this case, some parameters of a real well remain unaccounted for, which leads to significant errors. [2]
Other methods of defining the coefficient of instant boost of well productivity are the methods based on statistics laws. These include regression equations, ranking, factor analysis, etc. This approach differs from the statistic one by the fact that it makes it possible to account for factors present in a real deposit. Accuracy of statistic models depends on the sampling used. In case of low dispersion of initial data, the error in predictive calculations may reach 100% and more. [3]
Methods
In case of significant heterogeneity of the data for calculating efficiency of advanced recovery method, it is appropriate to use a mathematical apparatus of artificial neural networks (ANN). Neutral networks are the area of applied mathematics, which has recently been widely used in various technical fields. An ANN consists of a set of neurons interconnected in a certain way.
A neuron (nerve cell) consists of the so-called soma (cell body) and two tree-like external branches: dendrite and axon. The cell body contains a nucleus where the information about neuron properties is contained, and plasma that produces the materials needed for the neuron. The neuron, receiving pulses from other neurons via dendrites, transmits signals generated by the cell body along the axon branching at the end of the fiber. There are synapses at the ends of these fibers.
A synapse is a functional junction between two neurons (axon fibers of one neuron and the dendrite of the other one). When the pulse reaches the synapse end, chemical substances called neurotransmitters are generated. The neurotransmitters pass through the synaptic gap and, depending on the type of the synapse, excite or inhibit the ability of the receiving neuron to generate electric pulses. Since efficiency of the synapse is defined by the signals passing through, the synopses learn, depending on activity of the processes in which they participate. The neurons interact with each other using short series of pulses. The message is transmitted with the help of pulse-frequency modulation.
Experimental research shows that by their structure,biologic neurons are much more complex than the simplified explanation of the existing artificial neurons, which are elements of modern ANNs. Since neurophysiology provides scientists with expanded understanding of neurons action, and computing technology is constantly improving, developers of the networks have unlimited space for improving models of biological brain.
ANNs are electronic models of the neuron structure of the brain, which mainly learns on its own experience. The natural analog shows that many problems that cannot be solved with the use of traditional computers may be efficiently resolved with the help of neural networks.
Human brain has many qualities absent in modern computers. The most important are:
– adaptability;
– ability to learn and generalize;
– distributed representation of information and parallel computing;
– low power consumption; and
– tolerance to errors.
The instrument built on the principles of biological neurons has the above listed characteristics, which fact is a significant achievement in the industry of data processing.
Figure 1 schematically demonstrates a mathematical model of a neuron.
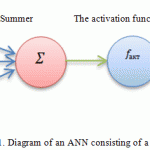 |
Figure 1: Diagram of an ANN consisting of a single neuron |
The task of analyzing the efficiency of advanced recovery methods is predictional; the classical multi-layer Rosenblatt’s perceptron is usually used for solving this class of tasks. [2-4]
The architecture of a multi-layer perceptron consists of series-connected layers, where the inputs of neuronsin each layer are connected to all neurons in the previous layer, and outputs – to all neurons in the next one. The signals received by the artificial neuron are called “synapses”. Each neuron calculates the non-linear transformation (according to its own activation function) from the linear combination of signals from the previous layer. The multi-layer neural networks learn with the help of the «back propagation of error» algorithm, which, in turn, is a method of gradient descent in the space of weights for minimization of the total network error [2, 5].
One of the criteria of model reliability (accuracy) is the mean square error. The mean square error in the process of training neural networks is minimized by the cross validation procedure. It involves dividing the trained set into two sub-sets (training and test ones), training on the training sub-set, and validation of the ability to forecast on the test sub-set (i.e., on the data not participating in the training). In case when the errors obtained in course of such calculations (the so-called “forecast error” or “training error”) are comparable by their magnitude, a conclusion can be made about stability of the calculation performed on this ANN model. Such a procedure serves as the criteria for choosing parameters of the neural network, i.e., the lower the difference between the errors in the testing and training sets is, the more accurate evaluation results of the neural network calculation are.
The following parameters should be defined for synthesis of a neural network model:
– topology;
– model input/output;
– input parameters normalization method; and
– activation function. [6]
Topology
V. I. Arnold (1957) and A. N. Kolmogorov proved the theorem which states that any continuous function of n variables can be represented using addition and superpositions of continuous functions of a single variable. The role of this theorem is that it shows a fundamental possibility to accurately present arbitrary complex functional dependencies with the use of structures made of simple elements, such as artificial neurons. Rather recently, several authors (Hornik, White, Staincomb (1989), Kibenko (1989), Funahashi (1989)) proved that any function of many variables in the form of F(x1,x2,…,xn) can be approximated with any desired accuracy, using a simple three-layer ANN with a sufficient number of neutrons in the second (hidden) layer, and appropriately chosen synaptic coefficients.
The well-known theorem of Arnold – Kolmogorov – Hecht – Nielsen was used for calculating the optimum number of neurons. The required number of neurons in the hidden layers of the perceptron is defined according to the formula, which is a consequence from this theorem:

where Ny is the dimension of the output signal; Q is the number of elements in the set of training examples; Nw is the required number of synaptic connections; and Nx is the dimension of the input signal. [7]
Using the formula, and having estimated the required number of synaptic connections Nw, one can calculate the required number of neurons in the hidden layers. The number of neurons in the hidden layer of a two-layer perceptron may be calculated according to the following formula:

Model input
Input parameters (input vector) were chosen in order to most fully characterize properties of oil formation. Such properties include:
- Physico-chemical properties of fluids that saturate the reservoir bed (viscosity of oil and water, content of paraffins in the oil).
- Geometrical and structural properties of the formation. These include parameters that characterize the size of the formation (the area of oil deposit, efficient oil saturated thickness), anisotropy along the strike (sandiness, roughness), and parameters that describe capacitive characteristic of the formation (porosity, oil saturation).
- Filtration properties of the formation and drained off liquid (displacement coefficient).[8]
Model output
At the output, the only parameter is obtained, namely,the coefficient of productivity; therefore in the outer layer of an ANN only one neuron will be present.
The method of input parameters normalization. Since all calculations made by using the method of artificial neural networks imply certain rules for presenting synaptic coefficients and values of activation functions, the input values cannot be supplied to ANN input arbitrarily. The input data should be normalized and remain in the range between 0 … 1.[2] To do so, the simplest method of normalization is used, according to which for each component of the vector the following formula is used:

where – maxxi and minxi – are the maximum and minimum values for all training selection. The same data processing formula is used for recalculating output vectors and transforming them into true values. [9]
Activation function
There are a many activation functions: sigmoid, threshold, tangential. The most frequently used activation function is the sigmoid

where ƒ is the activation function; wT is the transposed vector of weight coefficients and x is a vector consisting of input variables of the model. [10]
The neuron input receives vector (x1,x2,x3…xn), which is multiplied by the transposed vector of weight coefficients (w1,w2,w3…wn), the value of the activated function is received at the output of the neuron, depending on the result of multiplying the vector of weights by the input vector.
Before training, a test set example is defined from the general set of training examples, on which assessment of prediction properties of the trained neural network will be based. With this, the size and the nature of the training set of samples are established.
The solution of the task of analyzing the efficiency of advanced recovery methods will be values likew1,w2,w3…wn, which, at the output the ARM, will ensure efficiency value equal to yout with any input vector (x1,x2,x3…xn).The vector (w1,w2,w3…wn) is obtained by training the network. [11,12,13]
For training the network, a sampling is formed:
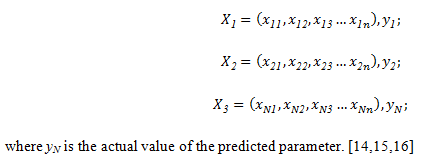
where yN is the actual value of the predicted parameter. [14,15,16]
Further, vector xi is supplied to the input of the neural network, and the yout value, the network output, is calculated, which is compared to the actual value of yi and, depending on the magnitude of the error, the vector of weight (w1,w2,w3…wn) is adjusted. The weights are adjusted until the error between the actual and predicted level reaches a certain threshold level.
The mathematical model of a neuron can be represented as follows:

where solution yout also depends on vector (w1,w2,w3…wn). [13] To evaluate ANN applicability for predicting instantaneous productivity growth coefficient after introducing ANN, it is necessary to compare it with the regression analysis. To do so, a two-layer neural network (Fig.2) will be used.
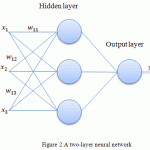 |
Figure 2: A two-layer neural network |
The procedure of creating an ANN includes defining the number of neurons in each layer of this network. The method of defining the number of neurons in a layer of the network should be between the number of input and output variable models, the number of neutrons should not exceed the double number of input variables.
For assessing the results of training, the following criteria of calculation accuracy are used in the proposed model of an artificial neural network:
– the absolute deviation (error) is calculated as the difference between the actual and predicted value of the parameter; it is the assessment of the absolute error of measurement;
– the relative error is the error of measurement expressed as the ratio of the absolute parameter calculation error to the actual value of this parameter;
– the mean square error – for calculation, all separate absolute errors were squared, summed, and the sum was divided by the total number of absolute errors, after which the square root was extracted. The resulting number characterizes the total error; the described characteristic is used for assessing results of training and testing artificial neural networks.
Results
The ANN model for analyzing efficiency of ARM was created in the Statistica program suite. After starting the SW package, the networks were trained and tested. Alter the calculation, the program displayed the best networks that could be used for viewing and analyzing the obtained results. Out of the obtained results, some networks that had the best scores in training, checking and testing sequences were chosen. The model was trained on 90% of the initial sampling, and the remaining 10% of the sampling were used for testing quality of model training. The sampling was made by the technological indicators of 50 wells. For training an ANN consisting of 8 neurons in the hidden layer with sigmoid activation function, the algorithm of multi-layer Rosenblatt’s perceptron was used. The change in the expected productivity coefficient of a production well after hydraulic fracturing of the formation was used as input data.
Hydraulic fracturing is the process where the pressure of liquid acts directly on the rock of the formation until it is fractured, and a crack appears. Prolonged exposure to pressure of liquid widens the crack downwards from the point of fracturing, and expands natural cracks.
After fracturing the formation with liquid pressure, the crack expands, and connects with the system of natural cracks, which had not been opened by the well, and with the areas of increased permeability; thus, the drained by the well area of the formation is expanded. Granular material (proppant) is forced into cracks formed by the fracturing, which contributes to fixing the crack in open state after removing excessive pressure.
Hydraulic fracturing increases the flow rate of extracting wells and intake capacity of wells many times, due to decreasing hydraulic resistance in the critical zone and increasing filtering capacity of the well; the final oil recovery increases due to joining poorly drained areas and interstratified beds to the deposit.
Hydraulic fracturing with formation of long cracks leads to increasing not only permeability of the near-well bore, but covering the formation with the exposure, adding additional reserves of oil to the development, and increasing the oil extraction coefficient. Doing so may reduce the current water content in the extracted products.
The highest efficiency of hydraulic fracturing maybe achieved in designing its use as an element of development system with regard to the system of placing wells and assessing their interaction in various combinations of production and injection wells. The effect of hydraulic fracturing is manifested non-uniformly in operation of separate wells, therefore it is necessary to consider not only the increase in production of each well after hydraulic fracturing, but the influence of mutual location of wells, specific distribution of non-uniformity of the formation, energetic possibilities of the facility, etc. Such an analysis is only possible based on a three-dimensional mathematical modeling of the process of developing the formation, or the facility in general, with the use of an adequate geological-development model, identifying the features of geologicalnon-uniformness of the facility. With the help of a computer model of the development process and of additional introduction ofANN into hydraulic fracturing, it is possible to assess the practicability of hydraulic fracturing of injection wells, the influence of hydraulic fracturing on oil extraction, and the rates of working out the reserves of the formation, to identify the necessity for repeated treatments, etc. In course of industrial implementation of hydraulic fracturing, it is necessary to compile a project document beforehand, where the technology of hydraulic fracturing would be justified and reconciled with the overall system of deposit development. In performing hydraulic fracturing, it is necessary to provide a complex of production research at the first-priority wells, for determining location, direction, and dimensionless fracture conductivity, which would make it possible to adjust the technology of hydraulic fracturing with regard to the peculiarities of each certain facility. Systematic designer supervision is required for the implementation of hydraulic fracturing, which would make it possible to make prompt decisions for increasing its efficiency.
In the Republic of Bashkortostan, where the studied field is located, hydraulic fracturing has been used relatively recently. In this regard, the method of increasing oil extraction rate has not been well studied to date. This fact points out upon the relevance of this research, and makes possible further use of artificial neural networks for analyzing efficiency of methods for increasing oil extraction at enterprises in this region.
It is necessary to calculate the coefficient of well production rate and the coefficient of increasing well production rate after hydraulic fracturing, using models. The calculations are made according to the information obtained for the wells in the Solonets deposit.[17]
The initial sampling is formed on the basis ofactual values of the productivity coefficient. Direct use of the results of hydraulic fracturing makes it possible to speed up the formation of the database, and excludes the interpretation of porosity and permeability. [18,19]
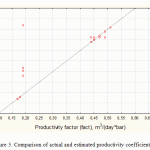 |
Figure 3: Comparison of actual and estimated productivity coefficients |
Figure 3 shows that the ANN model can provide more accurate efficiency analysis for the performed ARM, therefore, the error in calculating the productivity coefficient is less than that in the model based on the regression equation. The analysis of the above results shows that the built ANN is characterized by high quality of training.
The error for artificial neural networks was 8.4%, which is an allowable value for practical calculations.
For the analysis of the technological efficiency of the measure, it is necessary to consider changes in the most valuable parameters of well operation: fluid rate, oil production rate, and water content in the extracted product before and after fracturing. These parameters are presented in Table 1.1.
Table 1: Technological efficiency of hydraulic fracturing
| Well number | Liquid rate, t/day | Oil production rate, t/day | Water content, % | |||
| Before | After | Before | After | Before | After | |
| 1 | 4.9 | 28.4 | 1.3 | 5.4 | 68.4 | 74.3 |
| 2 | 2.9 | 19.9 | 0.2 | 4.6 | 93 | 74.8 |
| 3 | 3.1 | 5.3 | 2.5 | 4.0 | 16.7 | 22.2 |
| 4 | 6.2 | 13.4 | 5.9 | 1.6 | 4.2 | 54.3 |
| 5 | 3.9 | 28 | 2.8 | 1.5 | 23.5 | 92.6 |
| 6 | 4.9 | 15.7 | 3.7 | 10.8 | 18.8 | 26.3 |
| 7 | 5.5 | 21.7 | 0.7 | 4.7 | 84.4 | 74.5 |
| 8 | 8.7 | 24.4 | 3.9 | 6.9 | 49.6 | 65.7 |
| 9 | 1.9 | 8.5 | 1.83 | 6.1 | 3 | 23 |
| 10 | 1.5 | 2.7 | 1.4 | 0.5 | 8.2 | 81.1 |
Using an ANN, let us forecast the daily fluid rate for the Solonets deposit, and compare the actual data with the results obtained with the use of an ANN. TheANN model for analyzing efficiency of the hydraulic fracturing was created in the Statistica program suite. Sampling was made by the technological indicators of the first three wells.
Table 2: Results of calculating liquid flow-rate at the wells of the Solonets deposit
| Months | Well No.1 liquid rate, t/day | Well No.2 liquid rate, t/day | Well No.3 liquid rate, t/day | ||||||
| Actual | ANN | Error, % | Actual | ANN | Error, % | Actual | ANN | Error, % | |
| 1 | 5.5 | 3.5 | 4 | ||||||
| 2 | 6.3 | 3.9 | 4.2 | ||||||
| 3 | 5.9 | 3.4 | 3.7 | ||||||
| 4 | 5.8 | 3.2 | 3.8 | ||||||
| 5 | 5 | 3 | 3.7 | ||||||
| 6 | 4.9 | 2.9 | 3.1 | ||||||
| Performing hydraulic fracturing | |||||||||
| 7 | 28.4 | 27 | 4.93 | 19.9 | 20.9 | 5.03 | 5.3 | 5.6 | 5.66 |
| 8 | 27.5 | 26.5 | 3.64 | 18.3 | 18.4 | 0.54 | 4.9 | 5 | 2.04 |
| 9 | 24.3 | 23.5 | 3.29 | 17.6 | 17.1 | 2.92 | 4.6 | 4.5 | 2.17 |
| 10 | 23.6 | 23.1 | 2.12 | 16.2 | 16.7 | 2.99 | 4.59 | 4.4 | 4.14 |
| 11 | 23.5 | 22.5 | 4.26 | 15.7 | 14.9 | 5.37 | 4.53 | 4.3 | 5.08 |
| 12 | 22.4 | 21.7 | 3.13 | 15.3 | 14.6 | 4.79 | 4.32 | 4.1 | 5.09 |
Table 2 shows high accuracy of predicting with the use of an ANN. The average deviation of predicted values obtained with the use of an ANN from the actual data, is not more than 5%. This proves that the results of predicting a 2-level perceptron are the closest to the actual values. Much better results may be obtained with additional use of the method of principal components (MPC) for processing initial data. The method of principal components makes it possible to reduce the number of indicators required for efficient presentation of data, leaving out only the vectors with the greatest dispersion. After conversion, the results of prediction models will increase significantly
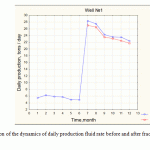 |
Figure 4: Comparison of the dynamics of daily production fluid rate before and after fracturing in well No. 1 |
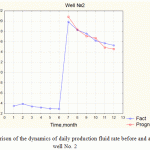 |
Figure 5: Comparison of the dynamics of daily production fluid rate before and after fracturing in well No. 2 |
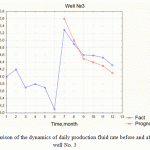 |
Figure 6: Comparison of the dynamics of daily production fluid rate before and after fracturing in well No. 3 |
Discussion
In recent years, attempts have been made to develop models for predicting efficiency of taking geological and technical actions with the use of an ANN. The main disadvantage of the developed models is the fact that they are not widely used, which is due to the specific geological and physical properties of various deposits, and the fact that the main characteristics of the formation are not used as key parameters. To understand the reason for a lower error of ANN’s prediction, it is necessary to consider its principle of action.
In order to build a multi-layer perceptron, it is necessary to choose its parameters. Most often, choosing the values of weights and thresholds requires training, i.e., changing weight coefficients and threshold levels one by one.
The algorithm for solving the task of predicting isas follows:
- Determine the meaning of input vector components. The input vector should contain formalized condition of the task, i.e., all the information necessary for getting the answer.
- Select the output vector y so that its components contain full solution to the problem in question.
- Choose the type of non-linearity in neurons (activation function). With that, it is desirable to take into account the specifics of the problem, since a good choice will reduce time of training.
- Choose the number of layers and neurons in the layer.
- Set the range for changes of inputs, outputs, weights, and threshold levels, taking into consideration the number of values of the chosen activation function.
- Assign initial values to weight coefficients, threshold levels and additional parameters (for example, steepness of the activation function, if it is adjusted during training). The initial values should not be too high, so that the neurons are not saturated (on horizontal section of the activation function), otherwise the training will be very slow. The initial values should not be too low, either, so that the output of the majority of neurons is not equal to zero, otherwise training will also be slow.
- Perform training, i.e., choose parameters of the network, so that the problem is resolved in the best way. Upon completion of training, the network is ready to solve problems of the type for which it has been trained.
- Send conditions of the problem in the form of vector x to the input of the network. Calculate the output vector y, which will be the formalized solution to the problem.
The network consists of an arbitrary number of neuron layers. The neurons in each layer are connected with the neurons in the previous and subsequent layers according to the “everyone with everyone” principle. The first layer (left) is called sensor, or input, the inner layers are called hidden, or associative, the last (rightmost, consists of a single neuron in the figure) is the output, or result. The number of neurons in the layers can be arbitrary. Usually, all hidden layers contain equal number of neutrons.[20]
Inside a cluster, non-uniformity of initial data is higher, as compared to the whole sampling, therefore, accuracy of prediction is higher, as compared to the regression equation, which is built based on the whole amount of data.
Analysis of operation efficiency is not only limited to defining instantaneous boost in well productivity.
Very often, within several months after the geological and technical measures, well flow rate decreases, which is caused by decreasing of the well productivity coefficient. This is called «PTA contamination, precipitation of salts, paraffins», etc. This is why it is very important to correctly predict further changes in the productivity coefficient after ARM. [21-24]. For calculating the productivity coefficient, an ANN with multiple outputs is the most appropriate tool.
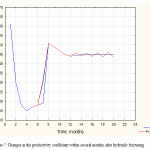 |
Figure 7: Changes in the productivity coefficient within several months after hydraulic fracturing |
In this case, each output of the ANN will receiveKwell.prod. in the corresponding time-slot after geological and technical measures. Figure 7 shows the comparison of the predicted ARM efficiency and the actual calculation.
Conclusion
From our study it follows that the proposed model of an artificial neural network for predicting results of geological and technical measures is the most efficient one [25, 26]. The accuracy of the calculation obtained with the use of the mathematical model of multi-layer perceptron was 8.4%.
In the course of creating a model of an ANN, optimal parameters of the network for training on a data array about strata of the Solonets deposit have been defined.
The main advantage of the model of artificial neural networks is the possibility to actualize results of calculations, if necessary,for example, in the future, when more detailed information for some geological parameters appears from the results of an additional research, discovering new oil deposits, seismic surveys, refining the size and the borders of oil-saturated formation after drilling, etc. Performing this kind of updates and refining the final ANN model is a less time-and-labor-consuming task, and makes it possible to improve the quality of predicted assessment of the final productivity coefficient. From this, it follows that there is a possibility to use an ANN model for calculating the productivity coefficient in case of missing data, which is rather useful in planning geological and exploration works and programs for deployment and commissioning of undeveloped deposits.
References
- Kruglov,V.V., M.I. Dli and R.Y. Golunov, 2001. Fuzzy logic and artificial neural networks. Moscow: Publishing House of Physical-Mathematical Literature, pp: 201.
- Gorban, A.N. and D.A. Rossiev, 1996.Neural network on a personal computer. Novosibirsk: Nauka, pp: 276.
- Stepanova,G.S. and A.H. Mirzadjanzade, 1977. Mathematical theory of experiment in oil and gas extraction.Moscow:Nedra, pp: 228.
- Osovsky,S., 2004. Neural network for information processing.Moscow:Finance and Statistics, pp: 345.
- Khaikin, S. 2004.. Neural networks: a comprehensive course. “Williams” Publishing house, pp: 1104.
- Oil production. Complete guide about oil, 2011-2014. Date Views: 19.02.2015 http://vsonefti.ru/upstream.
- Shandrygin, A.N. and A.A.Lutfullin, 2008. Main trends in developing methods of increasing the coverage of formations by action in Russia (SPE 117410).In the Proceedings of the Russian Oil and Gas Technical Conference of the Community of Petroleum Engineers, Moscow,pp: 1-23.
- Saaedi, А., J.Camarda and J-T. Liang, 2006.Using neural networks for candidate selection and well performance prediction in water-shutofftreatments using polymer gels – a field-case study (SPE-101028-PA). In the Proceedings of the SPE Asia Pacific Oil&Gas conference and exhibition, Adel-Aida,pp: 1-8.
- Kruglov, V.V., M.I.Dli, R.Y.Golunov, 2001. Fuzzy logic and artificial neural networks. Moscow:Publishing House of Physical and Mathematical Literature, pp: 221.
- Vasenkov, D.V., 2007. Methods of training artificial neural networks. Computer Tools in Education, 1: 20-29.
- Ruchkin, A.A., 2003. Increasing efficiency of using flow-deflecting technologies (on the example of hydro-dynamically connected collecting pipes at the Samotlor deposit), abstract from thesis of Candidate of Technical Sciences, Закрытоеакционерноеобщество «Тюменскийнефтянойнаучныйцентр» (ЗАО «ТННЦ»),Tyumen, pp: 25.
- Ivanov, E.N. and Y.M.Kononov, 2012. Choosing methods for increasing oil recovery on the basis of analytical assessment of geological and physical information. Bulletin of the Tomsk Polytechnic University, Vol. 321, 1: 149-154.
- Levenberg, K., 1944. The method for solving certain problems in the least squares. Journal of Applied Mathematics, 2: 164-168.
- Oil and gas production industry: Trends and Forecast. Date Views: 20.02.2015http:/vid1/rian.ru/ig/ratings/oil9/pdf.
- Keller, Y.A. and A.A. Uskov, 2013.Using the regression analysis theory and neural networks for assessing efficiency of using flow-deflecting technologies on the group of deposits of JSC Samaraneftegaz. Engineering Practice, 10: 56-57.
- Ivanov, E.N. and Y.M.Kononov 2012. Choosing methods for increasing oil recovery on the basis of analytical assessment of geological and physical information. Bulletin of the Tomsk Polytechnic University, Vol. 321, 1: 149-154.
- Saraev, P.V., 2007. Neural network methods of artificial intelligence: A tutorial. Lipetsk: LSTU, pp: 64.
- Halafian, A.A., 2007. STATISTICA 6. Statistical data analysis.Moscow:Binomial, pp: 508.
- Manzhula, V.G. and D.S. Fedyashov, 2011.Kohonen neural networks and fuzzy neural networks in intellectual data analysis. Fundamental Research, 2: 78-79.
- Senkovskaya, I.S. andP.V. Saraev, 2001. Automated clustering in analyzing data on the basis of self-organizing Kohonen maps. Bulletin of MSTU n.a. G. I. Nosov, 2: 78-79.
- Fattakhov, I.G.and R.N. Bahtizin, 2013. Application of the software product “prospecting” for analyzing and optimizing the efficiency of waterproofing work. Middle-East Journal of Scientific Research, 17(7): 919-925. DateViews: 15.02.2015 http://www.idosi.org/mejsr/mejsr17(7)13/14.pdf.
- Fattakhov,I.G.,R.N. Bahtizin,R.R. Kadyrov, T.U. Jusifov, S.A. Rabcevich, F.R. SafinandA.S. Galushka, 2013.Importance of modeling application to increase oil recovery ratio. Middle East Journal of Scientific Research, 17(11): 1621-1625.DateViews: : 20.02.2015 http://www.idosi.org/mejsr/mejsr17(11)13/22.pdf.
- Fattakhov, I.G. andR.N. Bakhtizin, 2011. Regulation ranks of associated water production decrease.Oil and Gas Business, 5: 213-219. DateViews: 19.02.2015 http://www.ogbus.ru/eng/authors/Bakhtizin/Bakhtizin_3e.pdf.
- Fattakhov, I.G., 2009. Classification of development objects using the method of principal components. OilfieldBusiness, 4: 6-9.
- Fattakhov, I.G., 2012. Integration of differential problems of intensification of oil production with applied programming.News of Higher Educational Institutions. Oil and Gas, 5: 115-119.

This work is licensed under a Creative Commons Attribution 4.0 International License.


