How to Cite | Publication History | PlumX Article Matrix
Diyanoosh Mardanbeigi, Mahmoud Ebrahimi*, Mohammad Reza Bozorgmehr
Department of Chemistry, Mashhad Branch, Islamic Azad University Mashhad, Iran.
DOI : http://dx.doi.org/10.13005/bbra/1867
ABSTRACT: Pesticides were extracted from the sample to the organic solvent immobilized in the fibre and they were desorbed in methanol prior to chromatographic analysis. Experimental parameters related to microextraction such as type of extraction time , organic solvent and agitation rate have been optimized. The extraction method has been validated for several types of real samples, and no matrix effect was observed. The technique requires minimal sample handling and solvent consumption. Using optimum conditions, low detection limits (0.03–3.91µgL−1) and good linearity (R2 > 0.96) were obtained. Repeatability ranged from 3.1 to 11.1%. Finally The obtained results indicated that the method can be successfully applied for microextraction and determination of pesticides in environmental samples.
KEYWORDS: Pesticides; extracted; Preconcentration
Download this article as:| Copy the following to cite this article: Mardanbeigi D, Ebrahimi M, Bozorgmehr M. R. Preconcentration and Determination of Organophosphorus Pesticides in Water Samples by Carbon Nanotube Reinforced Hollow Fiber Solid/Liquid Phase Microextraction and Gas Chromatography-Flame Ionization Detector. Biosci Biotech Res Asia 2015;12(3) |
| Copy the following to cite this URL: Mardanbeigi D, Ebrahimi M, Bozorgmehr M. R. Preconcentration and Determination of Organophosphorus Pesticides in Water Samples by Carbon Nanotube Reinforced Hollow Fiber Solid/Liquid Phase Microextraction and Gas Chromatography-Flame Ionization Detector. Biosci Biotech Res Asia 2015;12(3). Available from: https://www.biotech-asia.org/?p=2217 |
Introduction
Organophosphate compounds (OPs), which are most widely used as pesticides in agriculture for pest control and as nerve agents at military and home , gardens, are highly toxic chemicals [1–3]. Some of them have long lifetime and could find their way in food and water supplies. Long term interaction with these compounds could cause health problems and even death. Therefore, the development of portable and sensitive device for rapid and exact detection of OPs compounds on site has become increasingly significant for homeland security and health protection.
Solid-phase microextraction (SPME), a solvent-free extraction procedure, possesses several advantages into conventional liquid–liquid extraction (LLE) due to its simplicity [4–7]. It can achieve low detection limit and has acceptable reproducibility [7–10]. SPME–liquid chromatography (LC) is also possible, provided a suitable interface that permits solvent elution of the analytes is existent [11]. SPME is increasingly being used for pesticides residue analysis [12,13]. Because, it has a few drawbacks, such as linear range and limited lifetime, sample carryover, fragility of the fibers and relatively expensive fiber and fiber assembly holder [14]. Solvent-minimized liquid-phase microextraction (LPME) is considered an emerging alternative to SBSE or SPME and, in some instances, incorporates the use of porous hollow fiber membrane to support the solvent during extraction.
Graphene oxide (GO), aprecursor to grapheme after reduction, consists of a hexagonal carbon network bearinghydroxyl and epoxide functional groups on its “basal” plane, whereas the edges are mostly decorated by carboxyl and carbonyl [15,16]. These oxygen-containing functional groups can bind with metal ions, especially the multivalent metal ions, through both coordinate approaches and electro-static. It can be estimated that GO is an ideal adsorbent for metal ions. In recent times, the utilization of GO as a sorbent for the removal of heavy metal ions from water has been reported [17,18]. In various fields of chemical analysis, there have been an increasing number of applications of Graphene oxide . GO exhibit an extraordinary suitability of structural, mechanical and electronic properties, which have made them potentially useful in Graphene oxide -reinforced materials, as the sorbents for SPME and the like [19-21]. GO into the pores of polypropylene hollow fibers. This micro-bag membrane was used as a protective barrier for solid-phase microextraction (SPME) [22,23]. The idea is therefore to have a membrane based on GO that acts as an analyte trap, resulting in higher selectivity and enrichment because the GO act as solid sorbents do in SPME fibers. We have used this porous polypropylene membrane modified with GO to pre-concentrate organophosphorus pesticides from wastewater.
Experimental
Chemicals and Materials
Target pesticides: diazinon, fenitrothion, malathion and phosalone were purchased from Riedel-de Haen (Seelze-Hannover, Germany). Stock solutions of pesticides (2000 µg/mL) were prepared by dissolving calculated amounts of them in methanol. Fresh working solutions were prepared daily by diluting the stock solution in distilled water. All experiments were carried out at room temperature, 22±0.5 ◦C. Graphite powder(325mesh,99.9995%) was obtained from Alfa Aesar (MA,USA). P2O5 , K2S2O8, H2O2, KMnO4, HCl and H2SO4 were purchased from Sinopharm Chemistry Reagent Co. Ltd,China (Shsanghai,China). Acetonitrile,
methanol, toluene, acetone and 1-octanol were purchased from Merck (Schuchardt, Germany). Analyte, solvents, salts, acids, and bases were of analytical grade. The hollow fiber polypropylene membrane support Q3/2 Accurel PP (200µm thick wall, 0.6mm inner diameter and 0.2µm average pore size) was purchased from Membrana (Wuppertal,Germany).
Synthesis and Characterization of Graphene Oxide
GO was synthesized by the oxidation of exfoliated graphite using modified Hummer’s method from graphite powder using NaNO3, H2SO4, and KMnO4 in an ice bath as reported in literature [24]. A stock solution of GO single layers (0.25 mg mL−1) was obtained after sedimentation steps to eliminate unexfoliated materials. GO thin films were obtained by filtration through anodized aluminum oxide membrane with a nominal pore size of 0.02 µm. The GO after drying were thoroughly dispersed in 1-octanol by ultrasonication at room temperature for 0.5 h.
HF-SLPME Procedure
The membrane extraction with sorbent interface used in this research is a two-phase supported liquid membrane consisting of an aqueous organic solvent/nano sorbent aqueous system operated in direct immersion sampling mode. The GO dispersed in the organic solvent are introduced in the pores of a porous membrane and lumen hollow fiber. The analytes from the aqueous sample diffuses through the porous polypropylene membrane into the GO, which were dispersed in the organic solvent and filled the hollow fiber pores and lumen. the analytes are transferred to the small volume of acceptor phase that was flowing on the inside of the membrane and are thus enriched. 5µL of GO in1-octanol was drawn into a 10µL microsyringe. The needle tip was inserted into the hollow fiber (2.0cm length) and the assembly was then immersed in GO solution for about 15 s to impregnate the pores of the hollow fibers. After impregnation, the GO in the syringe was injected to the lumen of hollow fiber. The SLPME hollow fiber was then placed in the aqueous solution. The vial was sealed and the stirrer turned on. At the end of the extraction for a prescribed period of time at room temperature the hollow fiber was taken out from vial and transferred into a glass vial containing the optimal organic solvent (100 µL methanol) and the analytes were desorbed from fiber with ultrasonic agitation and centrifuged for 3 mi at 10000 rpm. 1.00µL of the organic solvent was withdrawn into the GC microsyringe and then injected into the GC-FID for further analysis. Due to the low cost, and to prevent the carryover effect, each hollow fiber piece only once was used in the experiments (see fig. 1).
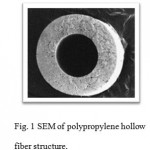 |
Figure 1: SEM of polypropylene hollow fiber structure. |
Sample Analysis
Wastewater and river Water Treatment
Wastewater and river water samples were filtered through a filter paper before analysis
Experimental optimization for the HF-SLPME
In order to obtain high enrichment and extraction efficiency of The OPs using this microextraction technique (HF-SLPME), the main parameters were optimized. FT-IR spectra was obtained from GO (fig. 2), it can be seen that C=O bond around 1735cm-1 and C–O bond around 1384 cm-1 [40], which are also visible in the GO spectra.
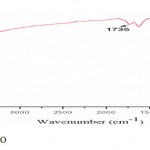 |
Figure 2: FT-IR spectra of GO |
Effect of the Extraction Time
Extraction was performed from 2 to 30 min to determine the effect of extraction time. Fig. 3 shows the peak area versus extraction time for the analytes. It can be seen that equilibrium is attained after 15 min. However, the increase on the peak areas for these analytes after 15 min extraction can be considered as not significant, but the results shows that there is a deterioration on the method precision for longer extraction times. Therefore, the extraction time was fixed in 15 min.
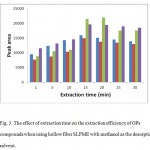 |
Figure 3: The effect of extraction time on the extraction efficiency of OPs compounds when using hollow fiber SLPME with methanol as the desorption solvent. |
Desorption Solvent Selection
Accordingly, several desorption solvents such as acetonitrile, 1-octanol, methanol and cyclohexane were investigated. Based on the obtained results, methanol was found to get the best microextraction efficiency, while its chromatographic peak was separated from the analyte peaks. Also because of its low vapor pressure at the extraction conditions the extract was stable at the microextraction period. Therefore, methanol was selected as the desorption solvent. It is noteworthy that an aqueous solution spiked into with the OPs (at the concentration level of 20 µg/L, was used in the extraction studies. Certainly thermal desorption is more efficient method than solvent desorption for the HF-SLPME. Therefore we have designed a simple device to online thermal desorption which is compatible with GC. This is under further development and we will use it in the next researche.
Effect of the Donor Phase Volume
As the analytes are extracted from large sample volumes into a very small volume of acceptor phase, most SPME applications provide substantial analyte enrichment. The preconcentration factor in HF-SLPME is basically determined by the analyte recovery and by the phase volume of the sample and the acceptor theoretically. As the volume of the sample increases, the pre-concentration factor also increases [25–27]. In HF-SPME, extraction is an equilibration process, therefore the amount of analyte partitioning into the acceptor phase becomes independent of the sample volume when this volume is much higher than the product of the partition constant and the volume of the acceptor phase. The effect of donor phase volume on the extraction efficiency of OPs compounds when using hollow fiber SLPME with methanol as the desorption solvent. Other extraction conditions: OPs concentration 20 µg/L, stirring rate 400 rpm, desorption time 10min, extraction time 15 min.
the other hand, a larger sample volume can even be disadvantageous due to poorer mass-transfer kinetics, resulting in undesirable extraction efficiency [28]. In the this work, the phase ratio of acceptor and donor solutions was optimized by changing the volume of the donor phase between 2 and 10 mL while the volume of acceptor phase was kept constant at 6µL. As seen in Fig. 4, however, the extraction results obtainedfor the analytes were most favorable to suggest a phase ratio of 830 (5mL donor phase volume). Also, with an increase in the aqueous phase volume, acceptor phase acceptor may too be a concern. This would lead to a decrease in the microextraction efficiency. Therefore, we selected a volume of 5mL as the optimized donor phase volume.
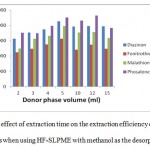 |
Figure 4: The effect of extraction time on the extraction efficiency of OPs compounds when using HF-SLPME with methanol as the desorption solvent. |
Effect of the Desorption Time
To reach the highest sensitivity, the desorption time was also appraised to ensure. Experiments showed that for all the studied four OPs compounds, desorption was almost complete after 10 min. Repeatability decreased in the desorption time less than 10 min . On the other hand, Above this time the amount of extracted analyte remained unchanged. Thus 10 min was used as the optimal desorption time.
Effect of the Stirring Rate
In order to hasten the mass transfer velocity from donor through organic membrane into acceptor in the extraction, magnetic stirring is usually used speedup means. The instrument’s response was recorded for several stirring rates ranging from 0 to 800 rpm for an extraction time of 15 min of 5mL aqueous samples with each target analytes concentration of 20 µg/mL. The results confirmed that perturbation of the sample enhances extraction. However, higher stirring rates (>500 rpm) resulted in massive air bubbles and decreased the preconcentration factors Factors. (see Fig 5)
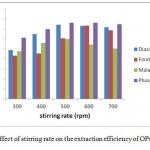 |
Figure 5: The effect of stirring rate on the extraction efficiency of OPs compounds |
Effect of the concentration of GO on the extraction
The effect of the amount of GO on the microextraction capacity has been studied and 0.2 mg/mLwas the optimal amount of the GO (the range was between 0 and 0.5 mg/mL) in this work. The results confirmed that increasing of the amount of GO declined repeatability. Since with increasing the amount of GO, the injection of massive reinforced composite into the fiber was difficult. Moreover the air bubbles occupied the fiber spaces.
Effect Addition of salt of pH and in water sample solution
The effect of increasing the salt of the water sample was appraise by adding NaCl (0–5%, w/v) into spiked aqueous sample (at a level of 20 µg/l for each OPs compound). According results, it is clear that the addition of salt (NaCl) into the aqueous sample solution can recuperate the extraction efficiency of the target analytes due to salting out effect. In the this work, extraction efficiency was increased by adding of NaCl at the concentration range of 0–3 %, w/v. Anyway, higher concentrations of salt curb extraction of the OPs. The presence of higher concentrations of salt change the physical properties of the extraction film and thus diminish the diffusion rates of the OPs into the organic and graphene phase [29,30].
The pH value of aqueous phase plays a fundamental role in the microextraction. Considering the aqueous solution pH is also one of the major key factors that it development the transfer of OPs from the donor phase to the HF-SLPME device. Therefore, after look over of the pH effect in the pH range 3–10, by adding the appropriate sodium hydroxide or hydrochloric acid solution to the aqueous phase.
The results approved that the OPs extraction performance reached a better level at pH 5 (see Fig. 6). When pH rose above 5, the peak areas of malathion and phosalone decreased. It is due to the happening of degradation under high alkaline condition. Based on thorough consideration, pH 5 was chosen for further research.
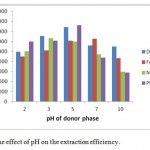 |
Figure 6: The effect of pH on the extraction efficiency. |
Figures of merit
To appraise the practical suitability and applicability of the HF-SPLME technique, the figures of merit of this method comprise pre-concentration factor, the corresponding regression equation, correlation coefficient (r2), limit of detection (LOD) and and linear dynamic range (LDR) were investigated under the best conditions. Calibration curves in wastewater were plotted against the concentration levels of the OPs compounds. For each level, four replicate extractions were performed. The results are tabulated in Tables 1. Furthermore, the theoretical pre-concentration factor (PF) is givenby the following equation:

where ARP,final and ASP,initial are the final and initial peak areas after and before microextraction of the OPs compounds in organic solvent, respectively that were obtained based on direct injection of the OPs solutions in methanol into the GC for analysis. Vaq and VIn are volume aqueous sample and internal volume of hollow fiber. the matured method has the merits of considerable analysis improved pre-concentration and speed, good separation efficiency, high sensitivity and notable precision.
Table 1: Figures of merit of the proposed method in the determination of the pesticide compounds in aqueous matrices.
| Analyte | LDR a(ng/mL) | R b | LODc (3σ) (ng/mL) | PFd | RSD% (n=5) | RR%e | Regression equationf |
| Diazinon | 20-12000 | 0.9857 | 18 | 265 | 3.92 | 86 | Y=9871.1X+14969 |
| Fenitrothion | 10-15000 | 0.9946 | 9 | 1276 | 3.13 | 90 | Y=47590X+47653 |
| Malathion | 10-18000 | 0.9756 | 11 | 397 | 5.35 | 86 | Y=376.80+976.65 |
| Phosalone | 10-20000 | 0.9934 | 9.5 | 763 | 6.53 | 82 | Y=3286X+3858 |
a Liner dynamic range
b Correlation coefficient
c Limit of detection
d Pre-concentration factor
e Relative Recovery after spiked amount of analytes
f Y and x are peak area and concentration of the analytes (ng/L), respectively
Real Samples
Applicability of the extraction method to extract the OPs compounds from aqueous samples were inspect ed. The analytical results of aqueous matrices are given in Table 2. The obtained results showed the RSD% about 1.9–5.9% for pesticides compounds, and indicates the repeatability of the suggested method. To evaluate the efficiency of the proposed method in real samples, it was in aprosperous manner applied to assay target analytes in an wastewater and river water, Mashhad, Iran as real samples. The all target pesticides were not found in the wastewater and river water samples, so relative recovery was determined as the ratio of the concentrations found in wastewater and river water samples spiked with the same amount of OPs compounds under the optimized conditions. The average relative recovery of the analytes from the weastwater and river water samples were higher than 88% . The results are tabulated in Tables 2. This exhibits that matrix effect does not have any significant effect on the extraction efficiency of the proposed method. HF-SLPME is a non-exhaustive extraction procedure and the relative recovery (determined as the ratio of the concentrations in real and blank samples, spiked with the same amount of OPs), instead of the absolute recovery (used in majority of extraction procedures), was employed.
The proposed method has several advantages such as good precision and accuracy, low cost,simplicity, quite short extraction time, and minimum organic solvent consumption. The hollow fiber SLPME device is disposable, so the single use of the hollow fiber reduces the risk of cross-contamination and carry-over problems. This procedurecan be successfully used for the analysis of OPs compoundsin aqueous samples. In addition, the experimental setup is highly affordable and very simple. Among the all reported microextraction techniques, this technique is an effective sample pre-concentration technique.
Table 2: Detected concentrations (ng/mL) of OPs compounds in weaswater and river water samples.
| River water | 15µgL−1spiked weaswater
Founded±SDa |
river water | 15µgL−1spiked river water
Founded±SDa |
|||
| Analtye | Conc.a | RSD% b | RR%c | Conc.a | RSD% b | RR% |
| Diazinon | ndd | 13.2 ± 0.15 | 88 | ndd | 13.8 ± 0.21 | 92 |
| Fenitrothion | nd | 13.6 ± 0.18 | 90.6 | nd | 13.2 ± 0.14 | 88 |
| Malathion | nd | 15.1 ± 0.12 | 100.6 | nd | 13.6 ± 0.19 | 90.6 |
| Phosalone | nd | 13.9 ± 0.13 | 92.6 | nd | 13.3 ± 0.16 | 88.6 |
a Founded concentration (ng/mL ).
b Relative standard deviation (n=5).
c Relative Recovery after spiked amount of analytes.
d Spiked amount of analytes
Conclusions
Conditions for the extraction and analysis of trace amounts OPs compounds in different aqueous samples such as extraction and desorption time, stirring speed and volume of the donor phase, and extraction time were investigated. The hollow fiber SLPME device is disposable, so the single use of the hollow fiber reduces the risk of cross-contaminationand carry-over problems. This procedure can be successfully used for the analysis of othere analytes in biological and aqueous samples.
In addition, the experimental setup is very simple and highly affordable. Among the all reported microextraction techniques, this technique is an effective sample preparation/pre-concentration technique.
We suggested on the use of GC–MS detection for further studies, for achieve the selective and specific detection technique as for application to monitor samples.
References
- G.D. Liu, Y.H. Lin, Anal. Chem. 78 (2006) 835.
- D. Du, J. Wang, J.N. Smith, C. Timchalk, Y.H. Lin, Anal. Chem. 81 (2009) 9314.
- V.B. Kandimalla, H.X. Ju, Chem. Eur. J. 12 (2006) 1074.
- J. Pawliszyn, Solid-Phase Microextraction: Theory and Practice, Wiley–VCH, New York, 1997.
- N. Fidalgo-Used, G. Centineo, E. Blanco-González, A. Sanz-Medel, Chromatogr. A 1017 (2003) 35.
- L. Cai, J. Xing, L. Dong, C. Wu, J. Chromatogr. A 1015 (2003) 11.
- S. Hamm, E. Lesellier, J. Bleton, A. Tchapla, J. Chromatogr. A 1018 (2003) 73.
- H. Prosen, L. Zupancic-Kralj, Trends Anal. Chem. 18 (1999) 272.
- C. Ibáñez, J. Chromatogr. A 1017 (2003) 161.
- P. D´ıaz, E. Ibáñez, F.J. Señoráns, G. Reglero, J. Chromatogr. A 1017 (2003) 207.
- Y.C. Wu, S.D. Huang, Anal. Chem. 71 (1999) 310.
- A. Penalver, E. Pocurull, F. Borrull, R.M. Marce, Trends Anal. Chem. 18 (1999) 557.
- J. Beltran, F.J. Lopez, F. Hernadez, J. Chromatogr. A 885 (2000) 389.
- Y. Yang, D.J. Miller, S.B. Hawthorne, J. Chromatogr. A 800 (1998) 257.
- D.W.Boukhvalov,M.I.Katsnelson,J.Am.Chem.Soc.130(2008)10697.
- K.N. Kudin,B.Ozbas,H.C.Schniepp,R.K.Prud’homme, I.A.Aksay,R.Car,Nano Lett. 8(2008)36.
- S.T.Yang,Y.L.Chang,H.F.Wang,G.B.Liu,S.Chen,Y.W.Wang,Y.F.Liu,A.N.Cao, ColloidInterf.Sci351(2010)122.
- G. Zhao,X.Ren,X.Gao,X.Tan,J.Li,C.Chen,Y.Huang,X.Wang,DaltonTrans. 40 (2011)10945.
- Y.Zhang,Y.W.Tan,Nature438(2005)201.
- A.A.Balandin,S.Ghosh,W.Bao,I.Calizo,D.Teweldebrhan,F.Miao,C.N.Lau, Nano Lett.8(2008)902.
- C. Lee,X.Wei,J.W.Kysar,J.Hone,Science321(2008)385.
- C. Basheer, A.A. Alnedhary, B.S.M. Rao, S. Valliyaveettil, H.K. Lee, Anal. Chem. 78 (2006) 2853.
- K. Hylton, Y. Chen, S. Mitra, J. Chromatogr. A 1211 (2008) 43.
- W.S. Hummers Jr., R.E. Offeman, Preparation of graphitic oxide, J. Am. Chem. Soc. 80 (1958) 1339.
- A. Sarafraz-Yazdi, Z. Es’haghi, J. Chromatogr. A 1082 (2005) 136.
- A. Sarafraz-Yazdi, Z. Es’haghi, Chromatographia 63 (2006) 563.
- E. Psillakis, N. Kalograkis, Trends Anal. Chem. 22 (2003) 565.
- Z. Es’haghi, Anal. Chim. Acta 641 (2009) 83.
- Q. Xiao, B. Hu, C. Yu, L. Xia, Z. Jiang, Talanta 69 (2006) 848.
- L.S. de Jager, A.R. Andrews, J. Chromatogr. A 911 (2001) 97.

This work is licensed under a Creative Commons Attribution 4.0 International License.


