How to Cite | Publication History | PlumX Article Matrix
O.Sulaiman
University of Malaysia Terengganu, Malaysia.
DOI : http://dx.doi.org/10.13005/bbra/2344
ABSTRACT: Biodiesel is an alternative fuel, has many benefits. It is biodegradable and non-toxic. Compared to petroleum based diesel, biodiesel has a more favourable combustion emission profile, such as low emissions of carbon monoxide, particulate matter and unburned hydrocarbons. These merits make biodiesel a good alternative fuel source to petroleum based fuel. Biodiesel feedstocks derived from microalgae and macroalgae have emerged as one of the most promising alternative sources alternative fuel because of lipid content, high photosynthetic efficiency to produce biomass and their higher growth rates and productivity compared to conventional crops. In addition to their fast reproduction, they are easier to cultivate than many other types of plants and can produce a higher yield of oil for biodiesel production. This study was undertaken to know the performance of seaweed as biofuel by comparing testing of B5 on engine test bed (CUMMINS NT 855-M Marine Diesel Engine) and mathematical estimation of energy yield from B5 and Seaweed. The performance test conducted for this study includes the speed, torque, Input Power, Brake Power, Break Specific Fuel Consumption and overall efficiency.
KEYWORDS: Biodegradable; Biodiesel; B5; Emission; Performance
Download this article as:| Copy the following to cite this article: Sulaiman O. Study the Performance of Biofuel From B5 and Laminaria Seaweed on Engine Test Bed for Marine Transportation. Biosci Biotech Res Asia 2016;13(4). |
| Copy the following to cite this URL: Sulaiman O. Study the Performance of Biofuel From B5 and Laminaria Seaweed on Engine Test Bed for Marine Transportation. Biosci Biotech Res Asia 2016;13(4). Available from: https://www.biotech-asia.org/?p=17046 |
Introduction
Growing concern regarding the petroleum reservoir and price has driven the research for an alternative fuel to accommodate increasing demand of vehicle population as well as minimise air pollution.Therefore, biodiesel is become an alternative fuel to be used for transportation sector and as a renewable source where the gases emissions are less than petroleum based fuel.
Biofuel contains energy from carbon fixation which is a process of conversion of inorganic carbon such as carbon dioxide to organic compound from living organism. Biofuel are generated by living organism through biomass conversion. Biomass is refers to recently living organism or more accurately to plant or plant-derived material. Biomass conversion converted the material into three ways that are thermal conversion, chemical conversion and biochemical conversion. The conversion drive results of producing fuel in solid, liquid or gas. There are many types of biofuel. The biofuel classifications include first generation biofuel and second generation of biofuel. Example of first generation of biofuel is Ethanol, Biodiesel, Bio-alcohols, Green diesel, Biofuel gasoline, Vegetable oil, Bio-ethers, Biogas, Syngas and Solid biofuel.
First generation of biofuel is often refers to conventional biofuel that are made from sugar, starch and vegetable oil. Second generation of biofuel is advanced biofuel. It means that the biofuel is produced from the various type of biomass. As the first generation was produced from sugar, starch and vegetable oil, the second generation was produced by lignocellulosic biomass or woody crops, agriculture residue or waste which makes it harder to acquire. Biofuel is a not a new founding for its resources but for its concept. Throughout the year after the world has suffer from the carbon emission, this leads to recent research regarding the biofuel.
The concept of using vegetable oil as an engine fuel is started by Rudolf Diesel (1858 – 1913) who developed the first engine run on peanut oil demonstrated as the World Exhibition in Paris on years 1900. Regrettably, he died in years 1913 before his idea of using vegetable oil is fully become efficient for the engine. The use of vegetable oils for engine fuels may seem insignificant today. But oil such as vegetable oil, may become in the course of time as important as the petroleum and coal tar products of the present time (Rudolf Diesel, 1912).
The aim of this study is to investigate the potential of seaweed as energy feedstock for biofuel. To achieve this aim, the following objective is set. The objective of this study is to assesfuel characteristic of seaweed and suitability for marine power plant. The second is to perform experimental test of B5 on the engine test bed. The third objective is to analyse and compare the performance B5 diesel and seaweed biofuel in term of power, torque and efficiency. The forth objective is to estimate the performance of seaweed biofuel by using mathematical formula based on the engine test bed specification in term of power, torque and efficiency
Methodology
This project is focused on the perform the experiment for B5 biofuel and perform the mathematical analysis on the seaweed biofuel. The data then is compared and analyse in term of power, torque and efficiency.
For mathematical analysis, the formula is obtained from the engine manual and also from the standardized formula. The experiment will perform the power, torque and efficiency experiment.
Project Flow Chart
The Figure below show the project flow chart. The study begins with the parametric study of seaweed biofuel. Then, seaweed biofuel will be analysing for its performance based on the mathematical formula in term of power, torque and efficiency. The B5 biofuel diesel will perform the experiment on the engine test bed. The data for both fuels then is compared and analyse.
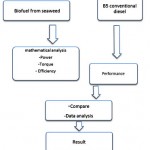 |
Figure 1 : Project Flow Chart |
Experiment Flow Chart
The Figure below shows the chart flow for the experiment test. The seaweed biofuel is analyse by mathematical formula. Using the mathematical formula, the analysis is performed in term of power, torque and efficiency. The B5 biofuel is evaluate base on experiment in term of power, torque and efficiency. Both data for the fuel is analysed and the result is organized.
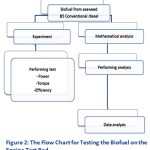 |
Figure 2: The Flow Chart for Testing the Biofuel on the Engine Test Bed |
Experiment Setup
The Figure below shows the experiment setup. From the fuel tank, then it go to the CUMMINS engine test bed. The data acquisition such as power, torque is acquired by the build in software for the engine. Another data acquisition is by using the gas analyser to obtain emission.
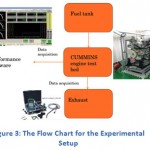 |
Figure 3: The Flow Chart for the Experimental Setup |
Mathematical Analysis
The mathematical analysis consists of several formula starting from calculating the indicate power / input power (IP), Torque. Brake power(BP), Brake Specific Fuel Consumption(BSFC) and overall efficiency
Mathematical formula
Calculate by using calorific value to calculate the power, torque, and BSFC.
Torque
![]()
Where P = power (kW), N= angular speed (RPM)
By using power on the equation above, it is same value for the input power(IP) from the fuel.
Power
P =IP
![]()
Where Qnet is the lower calorific value (KJ/KG), m = mass flow rate. m can be calculated by using the equation as follow:
![]()
V = volume flow rate of fuel (cm3/s ), ρ = density of water (Kg/cm3) , μ = specific gravity (Kg/cm3) , t = time taken (s)
Brake power for IC engine

N = engine speed (rev/s), T = torque (Nm)
Break specific fuel consumption (BSFC)
BSFC = m / bp (5)
Where m = fuel consumption (L/s) x specific gravity(Kg/l), Bp = brake power (kW)
Overall efficiency

Where bp = brake power (kW),mf = fuel flow (kg/s)
Potential Test
The equipment used for potential test is Marine Diesel Engine model CUMMINS NT 855-M test bed from laboratory at University Malaysia Terengganu. This equipment test for torque, power and fuel consumption.
 |
Graph 1: CUMMINS NT 855-M Marine Diesel Engine |
Result and Discusson
This chapter is discuss about the findings of this study. In the study, two types of test have been conducted. Each test is important to determine the performance of B5 diesel and biofuel from seaweed is estimated numerically. The test perform are the performance of engine operating at 25% load and the performance of engine operating at 40%. The biofuel analysis is carried out by numerical analysis to compare with the B5 diesel experiment on the engine test bed. The mathematical analysis consists of the theoretical experiment given in the engine and the standardise formula are also used. By using the engine specification and the procedure for the experiment, the performance of biofuel performance is determined
Parametric study
The table below shows the parametric study for different types of seaweed. In this study, the Laminaria species was selected based on the analysis.
 |
Table 1: The Analysis for Different Types Of Seaweed |
Performance Test
Torque, Power and Efficiency result
The Table below shows the result from the experiment for 25% load and 40% load
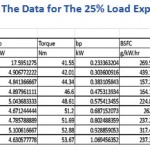 |
Table 2: The Data for The 25% Load Experiment
|
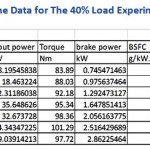 |
Table 3: The Data for The 40% Load Experiment
|
The Table below shows the result for the calculation for Laminaria seaweed biofuel for 25% load and 40% load
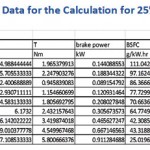 |
Table 4: The Data for the Calculation for 25% Load
|
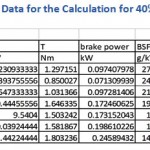 |
Table 5: The Data for the Calculation for 40% Load
|
Torque Result
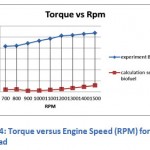 |
Figure 4: Torque versus Engine Speed (RPM) for 25% load
|
Figure is based on the table data presented for experiment and calculation for 25% load. The Figure shows the torque for the B5 biofuel diesel (blue) and the estimation of torque for biofuel seaweed (red). Based on the Figure, the torque for B5 biofuel diesel is much higher than biofuel seaweed.
For the B5 biofuel diesel, on the RPM 700 to 800, the torque increase slightly from 41.55 Nm to 42.01 Nm. The biodiesel also have the same pattern. The torque on the 700 RPM is 1.96 Nm and at the 800RPM is 2.24 Nm. From the RPM 800 to 1200, the torque for B5 biofuel diesel increase steadily. The torque is increase until it reaches 51.2 Nm at 1200 RPM. The torque for biodiesel however decrease at the 900 RPM with the torque 0.94 Nm and then increasing slowly until 1200 RPM with 2.43 Nm. From the 1200 RPM to 1500 RPM, the torque for B5 biofuel diesel increasing steadily until it reaches the peak value at 1500 RPM which is 53.67 Nm. The biodiesel also showing the increasing of torque until it reach its peak value at 1500 RPM which is 5.8 Nm.
Figure 5 is based on the table data presented for experiment and calculation for 40% load. The Figure shows the torque for the B5 biofuel diesel (blue) and the calculation torque for biofuel seaweed (red). Based on the Figure, the torque for B5 biofuel diesel is much higher than biofuel seaweed.
For the B5 biofuel diesel, on the RPM 700 to 800, the torque increase steadily from 83.89 Nm to 88.03 Nm. The biodiesel decrease pattern is observed. The torque on the 700 RPM is 1.29 Nm and at the 800RPM is 0.8 Nm. From the RPM 800 to 1200, the torque for B5 biofuel diesel increasing steadily. The torque increase until it reaches its peak value which is 101.29 Nm at 1200 RPM. The torque for biodiesel increasing at the 900 RPM with the torque 1.03 Nm until 1000 RPM which is 1.64 Nm, and then decreasing slowly until 1200 RPM with 1.58 Nm. From the 1200 RPM to 1300 RPM, the torque for B5 biofuel diesel decrease with the torque 97.72 Nm. The biodiesel also show the increase of torque until it reach its peak value at 1300 RPM which is 1.8 Nm
Input Power Result
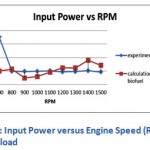 |
Figure 5: Input Power versus Engine Speed (RPM) for 25% load
|
Figure 6 is based on the table data presented for experiment and calculation for 25% load. The figure shows the result for input power both obtain from the mathematical formula. For the input power, it is obtain from the mass flow rate and the calorific value of the fuel.
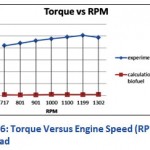 |
Figure 6: Torque Versus Engine Speed (RPM) for 40% load
|
For the conventional diesel, the input power at 700 RPM is the highest which is 17.59 kW. The value then dropped at the 800 RPM which is 5.7 kW. For biofuel, it is increase from 700 RPM to 800 RPM with the value 4.98 kW and 5.7 kW. The pattern for conventional diesel is seems to have the constant input power until 1400 RPM and slightly decrease at 1500 RPM with the value of 4.63 kW. For biofuel, from 800 RPM it decreases to 900 RPM with the value of 2.4 kW. Then, the input power keeps increasing until 1400 RPM and reaches its peak value which is 9.0 kW. After that, the input power decrease at the 1500 RPM with the value of 7.1 kW.
Figure 7 is based on the table data presented for experiment and calculation for 40% load. The Figure shows the result for input power both obtain from the mathematical analysis. The input power is obtain from the mass flow rate and the calorific value of the fuel.
For the conventional diesel, the input power decrease from 700 RPM to 800 RPM with the value of 28.19 kW and 18.46 kW. Then the input power increase from 1000 RPM which is 35.64 kW. The input power decrease slightly from 1000 RPM to 1100 RPM with the value of 35.64 kW and 32.67 kW. After that, the input power keeps increasing until it reaches 1300 RPM which is 39.03 kW. For biofuel, the input power is decreasing from 700 RPM to 800 RPM with the value of 8.23 kW and 5.39 kW. The value then keeps increasing until 1300 RPM which is 11.44 kW.
Brake Power Result
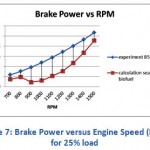 |
Figure 7: Brake Power versus Engine Speed (RPM) for 25% load
|
Figure is based from the table data presented for experiment and calculation for 25% load. The Figure shows the result obtain from the mathematical formula. For brake power, it is related to the torque, speed and pie value. So, the torque obtain from this experiment is used to calculate the brake power.
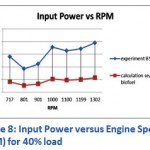 |
Figure 8: Input Power versus Engine Speed (RPM) for 40% load
|
For the conventional diesel, the brake power is increasing steadily from 700 RPM until 1500 RPM. The brake power at 700 RPM is 0.233 kW and the highest value for brake power at 1500 RPM which is 1.06 kW. For biofuel, the brake power is increasing from 700 RPM to 800 RPM with the value of 0.144 kW and 0.188 kW. Then, the value is decreasing to 900 RPM which is 0.08 kW. After that, the brake power for biofuel is increasing steadily until it reaches its peak value at 1500 RPM which is 0.911 kW.
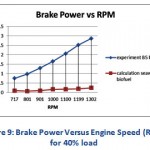 |
Figure 9: Brake Power Versus Engine Speed (RPM) for 40% load
|
Figure is based from the table data presented for experiment and calculation for 40% load. The Figure shows the result obtain from the mathematical formula. For brake power, it is related to the torque, speed and pie value. So, the torque obtain from this experiment will be used to calculate the brake power
For the conventional diesel, the brake power is increasing steadily from 700 RPM until 1300 RPM. Both values are 0.74 kW at 700 RPM and 2.86 kW at 1300 RPM. However, the graph pattern is not same with the B5 conventional fuel. The brake power is decreasing from 700RPM until 800 RPM with the value of 0.09 kW and 0.07 kW. The brake power is increasing steadily until 1300 RPM which is 0.24 kW.
Brake Specific Fuel Consumption Result
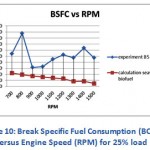 |
Figure 10: Break Specific Fuel Consumption (BCFC) versus Engine Speed (RPM) for 25% load |
Figure is based from the table data presented experiment and calculation for 25% load. The break specific fuel consumption (BSFC) is obtained from the experiment for conventional diesel and calculation from mathematical formula for biofuel. The BSFC is related to the fuel consumptions and the break power
For the conventional diesel, the BSFC is increasing from 700 RPM to 800 RPM. At 700 RPM the value is 269.5 g/kW.hr and at 800 RPM are 439.1 g/kW.hr. The BSFC reach its peak value at 800 RPM. It shows that the fuel consumption over the power produces at 800 RPM is at suitable speed. Then the BSFC is decreased at 900 RPM with the value 157.2 g/kW.hr. The BSFC keep increasing until 1200 RPM with the value 262 g.kW.hr. The BSFC is fluctuates from 1300 RPM until 1500 RPM. For the biofuel, the graph shows the steady decreasing for the BSFC. At the 700 RPM which is 111.04 g/kW.hr, it keep decreasing until 1500 RPM with the value 25.01 g/kW.hr.
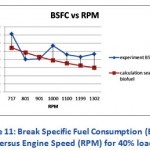 |
Figure 11: Break Specific Fuel Consumption (BSFC) Versus Engine Speed (RPM) for 40% load
|
Figure is based from the table data presented for experiment and calculation for 40% load. The break specific fuel consumption (BSFC) is obtained from the experiment for conventional diesel and calculation from mathematical formula for biofuel. The BSFC is related to the fuel consumptions and the break power
For the conventional diesel, the highest value for BSFC is at 700 RPM which is 357.2 g/kW.hr. The BSFC then decrease at 800 RPM which is 199.5 g/kW.hr. After that, the value of BSFC is keep increasing until 1000 RPM with the value 284.8 g.kW.hr. Then, the value is decrease until 1200 RPM and increase at 1300 RPM with the values of 215.3 g.kW.hr and 233.7 g/kW.hr.
Efficiency Result
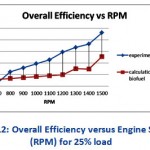 |
Figure 12: Overall Efficiency versus Engine Speed (RPM) for 25% load
|
Figure is based from the table data presented for experiment and calculation for 25% load. The overall efficiency for conventional diesel and biofuel both calculated using the mathematical estimation. For overall efficiency, the parameter that is considered is the brake power, fuel flow and calorific value.
For the conventional diesel, the overall efficiency is increasing steadily. The highest efficiency is at the 1500 RPM with the value 23.09%. It shows that when the small load is applied to the engine, it still can achieve high efficiency. For the biofuel, the efficiency also increasing steadily with the highest efficiency achieved at 1500 RPM with the value 12.8%. The difference between conventional diesel and biofuel in term of efficiency is about 10.3%.
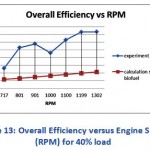 |
Figure 13: Overall Efficiency versus Engine Speed (RPM) for 40% load
|
Figure is based from the table data presented for experiment and calculation for 40% load. The overall efficiency for conventional diesel and biofuel both calculated using the mathematical estimation. For overall efficiency, the parameter that is considered is the brake power, fuel flow and calorific value
For the conventional diesel, the efficiency is increase until 900 RPM with the value 5.79%. The efficiency then drop to 4.6% at 1000RPM. Then, the value is increase again until it reaches its highest efficiency which is 7.33% at 1300 RPM. The efficiency for 40% load shows that when the engine is applied to the medium load, the efficiency is reduced. For the biofuel, the efficiency is increasing steadily until it reaches the highest value 2.14% at 1300 RPM.
Conclusion
This study has proven that biodiesel produces less power less than conventional diesel. This is due to the lower energy content per unit volume of the fuel.
Seaweed biofuel from Laminaria can be used as an alternative source of fuel. From the performance analysis, it shows the potential is quite far from the conventional diesel. A little modification can be done to the biofuel and used the MS123:1993 as a guideline in order to produce a competent fuel. Also, the biofuel can reduce the greenhouse gases emission as the fuel have less sulphur content and cloud point
Acknowledgement
The Author acknowledges the direct contribution of A.N Adhha in this work.
References
- ABM Sharif Hossain, A. S. (2008). Biodiesel Fuel Production From Algae as Renewable Energy. Ameriacan Journal of Biochemistry and Biotechnology, 250-254
- Amar Pandhare, A. P. (2013). Investigation on Performance and Emission Characteristic og Diesel Engine with Biodiesel (Jatropha Oil) and its Blends. Journal of renewable Energy, 1-11
CrossRef - AnoukFlorentinus, C. H. (2012). Potential of Biofuel for Shipping. Europe: European Maritime Safety Agency (EMSA)
- AS Ahmed, S. K. (2010). Journal of Energy and Environment. Biodiesel Production from Macro Algea as a Green Fuel for Diesel Engine,Kuala Lumpur,2010, 1-5.
- AS Silitonga, H. m. (2013). Experimental study on performance and exhaust emission of a diesel engine fueled with Ceibapentandra biodiesel blends. energy Conversion and Management,Kuala Lumpur,2013 826-836.
- Basha SA, R. G. (2009). A review on biodiesel production, combustion, emission and performance. Renew SustEnerg, 28-34
CrossRef - Douglas Bradly, F. D. (2009). World Biofuel Maritime Shipping Study. Austria: Energy Enconomic Group.
- E, B. (2010). Effects of biodiesel on a DI diesel engine performance, emission and combustion characteristics. Fuel, 99-105
- Fujia Wu, J. W. (2008). A study on emission performance of a diesel engine fueled with five typical methyl ester biodiesel. Atmospheric Environment,Beijing,2008 1481-1483
- G Roesijadi, S. J.-S. (2010). Macroalgae as a Biomass Feedstock: A Preliminary Analysis. Washington: Pacific Northwest National Laboratory
- Graboski MS, M. R. (1998). Combustion of fat and vegetable oil derived fuels in diesel engine. ProgEnerg Combust, 64-125.
CrossRef - Hansen AC, G. M. (2006). Diesel engine performance and NOx emissions from oxygenated biofuels and blends with diesel fuel. Trans ASABE, 589-595.
CrossRef - JinlinXue, T. E. (2011). Effect of Biodiesel on Engine Performance and Emission. Renewable and Sustainable Energy Reviews,USA, 1098-1116
- Olav Andreas Opdal, J. F. (2007). Biofuels in Ships. Norway: Norwegian Shipowners Association.
- Reith, J. a. (2004.). Microalgal Mass Cultures for Co-Production of Fine Chemicals and Biofuels and Water Purification. CODON Symposium “Marine Biotechnology; An ocean full of prospects ?”
- Tom Bruton, D. H. (2009). A Review of the Potential of Marine Algae as a Source of Biofuel in Ireland. Ireland: Sustainable Energy Ireland

This work is licensed under a Creative Commons Attribution 4.0 International License.


