How to Cite | Publication History | PlumX Article Matrix
Diversity in Cucumber Genotypes Based on Morphological Traits and SSR Molecular Markers
Sobhan Normohamadi1, Mahmood Solouki2 and Forouzan Heidari2
1Biotechnology, College of Agriculture, Department of Plant Breeding and Biotechnology,University of Zabol,Zabol, Iran.
2Faculty of Agriculture, Department of Plant Breeding and Biotechnology, university of Zabol, Zabol,Iran.
Corresponding Author E-mail: sobhannormohamadi@yahoo.com
DOI : http://dx.doi.org/10.13005/bbra/2507
ABSTRACT: Biodiversity is one of the most important factors in the survival and improvement of any species. Therefore, germplasm collection is the first step for plant improvement. To investigate their genetic and morphological relationships, 10 morphological traits of 20 genotypes of local cucumbers were evaluated using 9 SSR primers. A high genetic variability was observed for the number of flowers per plant. The values of the Jaccard similarity coefficient ranged between 0.51 and 0.92, indicating a high diversity of the genotypes. To evaluate the genetic similarity among genotypes, a cluster analysis using the UPGMA method was performed based on the Jaccard similarity coefficient. The average genetic distance between genotypes (using the Jaccard similarity coefficient) was 0.74 and the mean polymorphic information content (PIC) was 0.69. The primer SSR13251 had the highest PIC (0.8). The clustering pattern of the SSR markers did not coincide with the groupings based on quantitative traits. A dendrogram of the cluster analysis of molecular data showed a high diversity among the studied genotypes. The highest genetic similarity was between genotypes 2 and 3 (0.94), and the lowest genetic similarity was between genotypes 6 and 12 (0.51). The results suggest that SSR markers are a suitable tool to study the genetic diversity and relationships among different genotypes in cucumber.
KEYWORDS: Cucumber; Dendrogram; Genetic relationship; SSR Molecular marker
Download this article as:| Copy the following to cite this article: Normohamadi S, Solouki M, Heidari F. Diversity in Cucumber Genotypes Based on Morphological Traits and SSR Molecular Markers. Biosci Biotech Res Asia 2017;14(2). |
| Copy the following to cite this URL: Normohamadi S, Solouki M, Heidari F. Diversity in Cucumber Genotypes Based on Morphological Traits and SSR Molecular Markers. Biosci Biotech Res Asia 2017;14(2). Available from: https://www.biotech-asia.org/?p=25791 |
Introduction
Cucumbers (2n=2x=14), belonging to the Cucurbitaceae family, are one of the most important vegetables (Jeffery, 1980). They can be used in salads or in processed forms (pickled, salty). The primary origions of diversity cucumber varieties have reported Inddia (Wehner and Robinson, 1991). The global production of cucumbers was 57.55 million tons in 2010. The study of genetic diversity examines the difference or similarity between species, populations or individuals using special statistical methods and models based on morphological characteristics, stemma information or molecular features of individuals (Bommineni et al., 1997). The higher the genetic diversity is in a community, the wider the choice domain will become and this genetic diversity is the basis for all selections (Pitrat M., 1991). There are different methods used to study the genetic diversity and structure of plant genotypes. Studying morphological traits is a classic example; however, given that the number of morphological traits is limited and is influenced by the age of the plant and the environment, more specific methods, such as molecular markers, are used at present (Fares et al., 2009). Previous studies have shown the genetic diversity of cucumber varieties using physiological parameters, fruit characteristics and molecular markers. For instance, Simple sequence repeat (SSR) and Inter simple sequence repeat (ISSR) markers have been used to determine the genetic diversity and fingerprints of cucumber and melon varieties. (Pandey et al., 2013; Parvathaneni et al., 2011). Sequence-related amplified polymorphism (SRAP) and Random amplified polymorphic DNA (RAPD) are additional molecular markers that have been used to determine the genetic diversity of cantaloupe varieties (Yildiz et al., 2011). Microsatellite markers, the second generation of DNA markers, are commonly used due to their high diversity, frequency, repeatability, Mendelian inheritance and codominant nature. Microsatellites are repeated simple sequences or a highly varied sequence of arrays of short motif(1-6 nucleotides) markers. Microsatellite markers can be used toanalyze the genetic structure of populations, stemma analysis and kinship determination, and location of controller genes of quantitative traits (Li et al., 2000). Most known microsatellites in one species can be used in other species and this shows their transmissibility (Wunsch 2009). SSR markers have a large potential for identifying polymorphism and heterozygosity in one species, making it possible to distinguish many alleles at one gene locus (Pawell, 1996). Genetic diversity in cucumber has been studied with molecular markers including RAPD (Horejsi and Staub, 1999), AFLP (Li et al., 2004), ISSR ((Wang et al., 2007, SSR (Danin-Poleg et al., 2001),) and EST-SSR (Hu et al., 2010).
In general, local varieties of Iranian cucumbers are not often cultivated due to their low performance and quality. Large quantities of expensive commercial seeds are imported annually into Iran. Additionally, the neglect of local varieties is eliminating them, subsequently eliminating genetic resources that are often compatible with Iran’s climates. For this reason, the identification and restoration of local Iranian cucumber varieties is essential for use in the country’s future eugenic programs. The aim of this study is to investigate the morphological and molecular diversity of a number of local cucumber genotypes, to determine the most appropriate genotypes for heterosis and hybridization and to evaluate the marker performance in separating the genotypes.
Materials and Methods
Plant Materials and Extraction of DNA
Inthisstudy, 20 genotypes of cucumber were used (Table 1). DNA extraction of all genotypes was done fromyoung, non-developed leaves using the cetyl trimethylammonium bromide (CTAB) method (Doyle and Doyle, 1987).
Table 1: Studied genotypes and their origins
| No. Genotype Origin | |||
| Abadeh (Fars) | TN-141-94 | 1 | |
| Sarband (Markazi) | TN-154-94 | 2 | |
| Orumieh (West Azarbayejan) | TN-163-94 | 3 | |
| Nahavand (Hamedan) | TN-166-94 | 4 | |
| Sarband (Markazi) | TN-180-94 | 5 | |
| Minab (Hormozgan) | TN-186-94 | 6 | |
| Markazi | TN-200-94 | 7 | |
| Taft (Yazd) | TN-204-94 | 8 | |
| Mazandaran | TN-206-94 | 9 | |
| Baneh (Kordestan) | TN-211-94 | 10 | |
| Sanandaj (Kordestan) | TN-215-94 | 11 | |
| Orumieh (West Azarbayejan) | TN-218-94 | 12 | |
| Kankan (Booshehr) | TN-221-94 | 13 | |
| Esfahan | TN-226-94 | 14 | |
| Noshahr (Mazandaran) | TN-229-94 | 15 | |
| Varamin (Tehran) | TN-244-94 | 16 | |
| Roodbar (Gilan) | TN-250-94 | 17 | |
| Roodbar (Gilan) | TN-251-94 | 18 | |
| Zanjan (Zanjan) | TN-262-94 | 19 | |
| Neishaboor (KhorasanRazavi) | TN-264-94 | 20 | |
Data Collection
The experimental design was randomized completed block (RCBD) with three replications. The distance between rows was 50 cm and the distance between plants was 40 cm. Each replicate included ten plants. Five plants were randomly selected and data on ten quantitative traits were recorded (including root length, plumule length, number of primary branches per plant, number of days from three-leaf to six-leaf stage, the number of flowers per plant, number of days until the beginning of flowering and plant height).
PCR Reaction and SSR Analysis
The quantity and quality of extracted DNA was examined through spectrophotometry at wavelengths 260 and 280 nm, and agarose gel electrophoresis was determined at one percent. A polymerase chain reaction was conducted using nine pairs of primers (Table 2). The thermocycler program was the following: one denaturation cycle for 94 min at 4°C, 36 cycles including denaturation at 94°C for one minute and connection of primers to pattern strings, depending on the type of primer, at 50-58°C for one minute, extension at 72 °C for one minute and a final extension cycle was performed for ten minutes at 72°C. The separation of reaction products was accomplished using agarose gel (2.5%) and staining was done with ethidium bromide. Polymorphic patterns, based on the presence or absence of bands, were scored one and zero, respectively. The cluster analysis of the data,based on the Jaccard similarity coefficient, using the Unweighted pair group method with arithmetic mean (UPGMA) method was conducted using the software NTSYSpc (ver. 2.02). The polymorphic information content of each SSR marker was calculated with the following formula:
PIC = 1- ΣinPi2 (Manifesto et al., 2001).
Table 2: Properties of microsatellite markers used in this study
| Primer | Sequence | number of alleles | percentage of Polymorphism. | Length | optimum connection temperature | Motif |
| SSR12227 | F:5- GGCATCGGTGAGTACCAACT-3
R:5- TTTCTCCTCCTTGGCCATAA-3 |
4 | 0.7 | 176 | 58 | (TGTTTT)7 |
| SSR22071 | F:5- GCTGCTTGAATCGGTTCTGT-3
R:5- GAGGAGGTAAATCATGCTCCA-3 |
6 | 0.72 | 204 | 58 | (AAG)8 |
| SSR05737 | F:5- TTGCCTTCGTAAGCAAAA-3
R:5- GAAGTAAATGGGTTGGAC-3 |
5 | 0.66 | 185 | 54 | (CT)17 |
| SSR19430 | F:5- TATGGCGAAGCTTTGCT-3
R:5- AGGGGGATCTTGCCTCTA-3 |
7 | 0.76 | 190 | 52.7 | (AAG)11 |
| SSR05125 | F:5- TGGGAAAAAGGGTATGGAAA-3
R:5- TGGCTCCTTCACATTGTTGT-3 |
4 | 0.64 | 220 | 57 | (GAAA)7 |
| SSR06660 | F:5- GATCGTTGCAAAACTCACGA-3
R:5- CGATTGACAGTTCGCTGAAA-3 |
2 | 0.77 | 197 | 54 | (AG)14 |
| SSR16842 | F:5- TGGGGTTAGGGTTCAAGTG-3
R:5- CAAGCTCTTCCTCAACGGAC-3 |
5 | 0.78 | 144 | 58.1 | (AGA)11 |
| SSR13251 | F:5- GGTCAATCCAAAAGAGAAAGCA-3
R:5- ATCAACACCATTGACGACCA-3 |
7 | 0.8 | 162 | 54 | (AAG)14 |
| SSR15477 | F:5- CTGCCATTTCTGGGTTTGAT-3
R:5- AATTCTTCTGGGAATGGCCT-3 |
2 | 0.44 | 213 | 54 | (AAAG)12 |
Results
Morphological Analysis
Table 3 presents details of the ten morphologic traits observed. The magnitude of changes to the domain emphasized the considerable diversity in most of the observed traits. Number of flowers per plant had a change to the domain of 30, which was the largest change in the studied genotypes. Plant height, with an average of 22.56, and number of primary branches, with an average of 2.33, were the second and third largest changes. The smallest changes were for the number of days to the beginning of flowering, number of days to the 4-leaf stage and number of days to the 6-leaf stage. The number of flowers per plant in genotype one was maximum and equal to 50. the root length in genotype six had the highest value with 7.9 cm. The plant height in genotype 1 was maximum and equal to 35 cm. The variance analysis showed that the difference among genotypes for all traits was significant for genetic diversity among the studied genotypes. Most of traits had significant genetic diversity at a probability level of 99%; only the number of primary branches per plant had significant genetic diversity at a probability level of 95%. The variation coefficient was less than 30 in most of the studied traits, whichindicates experimental accuracy (Table 4).
Table 3: Measuredmorphological traitsof 20 cucumber genotypes
| No. | Trait | Mean | SD | Minimum | Maximum | Change range |
| 1 | plumule length | 2.57 | 0.77 | 1 | 4 | 3 |
| 2 | root length | 5.87 | 1.18 | 4 | 7.90 | 3.9 |
| 3 | number of primary branches per plant | 2.33 | 0.49 | 2 | 3 | 1 |
| 4 | days remaining to beginning of flowering | 81.57 | 4.62 | 70 | 92 | 22 |
| 5 | number of flowers per plant | 30.22 | 8.75 | 20 | 50 | 30 |
| 6 | days remaining to 3-leaf stage | 44.01 | 6.03 | 32 | 51 | 19 |
| 7 | days remaining to 4-leaf stage | 52.66 | 5.64 | 40 | 62 | 22 |
| 8 | days remaining to 5-leaf stage | 61.90 | 6.81 | 51 | 72 | 19 |
| 9 | days remaining to 6-leaf stage | 69.55 | 7.26 | 51 | 80 | 29 |
| 10 | plant height | 22.56 | 6.38 | 12 | 35 | 23 |
Table 4: Mean of squared analysis of variance of measured traits in cucumber genotype
| Source of variation | Degree of freedom | Plumule length | Root length | Number of primary branches | days remaining to beginning of flowering | number of flowers
per plant |
Days to 3-leaf stage | Days to 4-leaf stage | Days to 5-leaf stage | Days to 6- leaf stage | Plant height |
| replication | 2 | 0.07 | 0.17 | 0.03 | 3.12 | 9.38 | 6.35 | 2.38 | 0.79 | 6.16 | 2.10 |
| Genotype | 19 | 1.68** | 4.24** | 0.39* | 58.81* | 233.41* | 105.97** | 90** | 136.22** | 155.41** | 123.49** |
| error | 38 | 0.09 | 0.039 | 0.17 | 3.79 | 2.25 | 3.48 | 4.44 | 4.20 | 4.14 | 1.74 |
| Coefficient
variation (cv) |
11.91 | 3.36 | 18.1 | 2.38 | 4.96 | 4.24 | 4 | 3.31 | 2.92 | 5.85 |
*,**: respectively significant in possible level of 1 to 5 percents
Cluster Analysis Based on Quantitative Traits
Using the application 2.02 NTSYS, a dendrogram was drawn and the genotypes were clustered into three main groups (Figure 1). The first cluster included genotypes 1, 7 and 20, the second cluster included seven genotypes, and the third cluster included eleven genotypes.
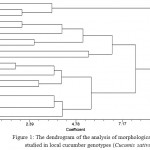 |
Figure 1: The dendrogram of the analysis of morphological traits studied in local cucumber genotypes (Cucumis sativus)
|
Molecular Analysis
The results of the polymerase chain reaction were separated on electrophoresis gels (Figure 2, 3 and 4). In total, 41 alleles in the studied genotypes were amplified with a mean of 4.55 per markers. The highest number of alleles was produced by primer SSR19430 (7 alleles) and the lowest numbers of alleles were created by primers SSR06660 and SSR15477 (2 alleles). The size of the bands was between 144 (SSR16842) and 220 (SSR05125). The mean PIC was 0.69. The highest amount of PIC in a marker (SSR13251) was 0.8 and the lowest (SSR15477) was 0.44. The high level of PIC in this study is indicative of the high level of differentiation. The amount of polymorphic information is an important parameter to compare markers, in terms of differentiation power. The high amounts of this criterion indicates high polymorphism and the presence of a rare allele or alleles at one marker locus and shows the high discriminatory and differentiation power of that marker (Varshney et al., 2004)
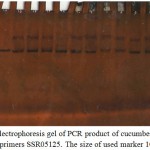 |
Figure 2: Electrophoresis gel of PCR product of cucumber genotypes with primers SSR05125. The size of used marker 100 bp
|
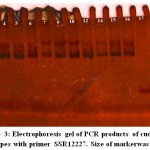 |
Figure 3: Electrophoresis gel of PCR products of cucumber genotypes with primer SSR12227. Size of markerwas 100 bp
|
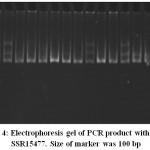 |
Figure 4: Electrophoresis gel of PCR product with primer SSR15477. Size of marker was 100 bp
|
Cluster Analysis Based on SSR Markers
The Mantel test (Mantel, 1967) for the Jaccard similarity coefficient, Dice and simple adaptation based on UPGMA method was performed. According to the Jaccard similarity coefficient matrix, the coefficient of genetic similarity among the studied genotypes ranged from 0.51 to 0.92. Genotypes 2 and 3 of the Markazi and West Azarbayejan provinces, respectively, showed the highest similarity among the studied genotypes with a genetic similarity coefficient of 0.94. Genotypes 6 and 12 of the provinces of Hormozgan and West Azarbayejan (Uromieh), respectively, showed the lowest similarity among studied genotypes with a genetic similarity coefficient of 0.51. The cluster analysis of the studied cucumber genotypes using UPGMA (Figure 5) resulted in three groups. The first group included genotypes 1, 2, 3, 4, 9, 10, 11, 12 and 13, among which 10, 11, 12 and 13 showed the greatest similarity among the genotypes of this category. Genotype 1 showed the most difference with the other genotypes in this category. The second group included genotypes 14, 15, 16, 17, 18, 19 and 20, among which 14, 15, 16 and 17 showed the greatest similarity among the genotypes of this category. The third group included genotypes 5, 6, 7 and 8, among which genotypes 5 and 6 showed the most similarities among the genotypes of this group. Genotype 8 showed the greatest difference with the rest of the genotypes in this category. In the principal coordinate analysis diagram, (Figure 6) genotypes 14, 15, 16, 17, 18, 19 and 20 are placed in a position relatively close to each other. Genotype 12 was placed at a farther distance and genotypes 11 and 13 were separated from each other and the other genotypes. Thus, the classification resulting from the principal coordinate analysis nearly corresponded to the cluster analysis classification. To show the correlation between the input matrix (molecular data) and the output matrix, the cophenetic correlation coefficient calculated for the molecular data was 0.66, showing that there was not a high correlation between the data.
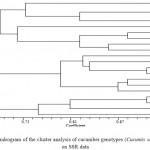 |
Figure 5: Dendrogram of the cluster analysis of cucumber genotypes (Cucumis sativus) based on SSR data
|
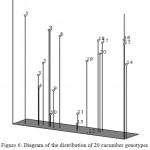 |
Figure 6: Diagram of the distribution of 20 cucumber genotypes in the principal coordinate analysis
|
Discussion
Comparison of Morphological and Molecular Data
The comparison of the cluster analysis, based the ten morphological characteristics, and SSR molecular data revealed that there was little similarity between these two patterns. The results of the principal components analysis confirmed the results of the cluster analysis. Moreover, the calculation of the cophenetic correlation coefficient (Mantel, 1967) between the matrix of similarity of morphological and molecular data (r=0.25) showed no significant correlation between them. As the heritability of morphological traits is very low and environmental factors strongly influence these traits, the poor match of these traits with molecular data is realistic. In addition, there is a high accuracy and specificity of microsatellite markers and the heritability of these markers. However, since the number of markers used in this study is very low compared with the total genome, only a small part of the genome has been investigated and evaluated by microsatellite markers. Therefore, the possibility that these particular markers did not cover the coding genes of morphological traits is also very high, resulting in the poor match between molecular data and morphological traits. This same discrepancy was found in a study of the genetic diversity of cucumber varieties in India (Pandey et al., 2013).The results of this study demonstrated the ability of SSR molecular markers to separate different genotypes of cucumber. The results of a cluster analysis showed that geographic distances are not a reason for the genetic farness or proximity of the studied genotypes. The analysis of SSR data suggests that, among the microsatellite markers used in this study, makers SSR16842 and SSR13251 (concerning the number of tracked alleles and the above polymorphic information content) are suitable for studying cucumber genotypes in Iran.
Acknowledgments
The authors of this article wish to express their gratitude to the Institute of Biotechnology of the University of Zabolfor providingspace for this study.
References
- Bommineni V. R., Jauhar P. P., Peterson T. S and Chibbar R. N. Analysis of hybrids of Durum Wheat with Thinopyrumjunceiforme using RAPD markers. Theoretical and Applied genetics. 1997;95:757-763.
CrossRef. - Danin-Poleg Y., Reis N., Tzuri G and Katzir N. Development and characterization of microsatellite markers in Cucumis. Theoretical and Applied genetics. 2001;102:61-72.
CrossRef. - Doyle J. J and Doyle J. L. A rapid DNA isolation procedure from small quantities of fresh leaf tissues. Phytochemical Bulletin. 1987;19:11–15.
- Horejsi T and Staub J. E. Genetic variation in cucumber (Cucumissativus L) as assessed by random amplified polymorphic DNA. Genetic Resources and Crop Evolution. 1999;46:337-350.
CrossRef. - Hu J., Li J., Liang F., Liu L and Si S. Genetic relationship of a cucumber germplasm collection revealed by newly developed EST-SSR markers. Journal of Genetics. 2010;89:28-32.
- Jeffery C. A review of the Cucurbitaceae. Botanical Journal of the Linnaean Society. 1980;81:233-247.
CrossRef. - Li C. D., Rossnagle B. G and Scoles G. J. The development of oat microsatellites markers and their use in identifying relationships among Avena species and oat cultivars. Theoretical and Applied Genetics. 2000;101:1259-1268.
CrossRef. - Li X., Zhu D., Du Y., Shen D., Kong Q and Song J. Studies on genetic diversity and phylogenetic relationship of cucumber (Cucumissativus L) germplasm by AFLP technique. ActaHorticulturae. Sin. 2004;31:309-314. (in Chinese, with English abstract).
- Manifesto M. M., Schlatter A. R., Hopp H. E., Sua-rez E. Y and Dubcovsky J. Quantitative evaluation of genetic diversity in wheat germplasm using molecular markers. Crop Science. 2001;41:682-690.
CrossRef. - Mantel N. The detection of disease clustering and generalized regression approach. Cancer Research. 1967;27:209-220.
- Pandey S.,Ansari W. A.,Mishra V. K and Singh M. Genetic diversity in Indian cucumber based on microsatellite and morphological markers. Biochemical Systematics and Ecology. 2013;51:19–27.
CrossRef. - Parvathaneni R. K., Natesan S., Devaraj A. A., Muthuraja R., Venkatachalam R., Subramani A. P and Laxmanan P. Fingerprinting in cucumber and melon (Cucumis spp.) Genotypes using morphological and ISSR markers. Journal of Crop Science and Biotechnology. 2011;14:39-43.
CrossRef. - Pitrate M. Linkage group in cucumismelo L. Journal of Heredity. 1991;82(5):406-411.
CrossRef. - Varshney R. K., Granera A and Sorrellsb M. E. Genetic microsatellite markers in plants: Features and application. Trend Biotechnology. 2004;23:48-55.
CrossRef. - Wang J., Xu Q., Miao M. M., Liang G. H., Zhang M. Z., Chen X. H. Analysis of genetic relationship of cucumber (Cucumissativus L) germplasm by ISSR markers. Molecular Breeding. 2007;5:677-682.
- Wunsch A. Cross-transferable polymorphic SSR loci in Prunus species. Scientia. Horticulturae. 2009;120:348-352.
CrossRef. - Yildiz M., Ekbic E., Keles D., Sensoy S and Abak K. Use of ISSR, SRAP, and RAPD Markers to Assess Genetic Diversity in Turkish Melons. Scientia Horticultura. 2011;130(1):349-353.
CrossRef.

This work is licensed under a Creative Commons Attribution 4.0 International License.


