How to Cite | Publication History | PlumX Article Matrix
Growth Characteristics of Indian and Nigerian Chlorella Pyrenoidosa used as food Supplement
Onwurah Christian, Shahana Majumder and Pankaj Taneja
Department of Biotechnology, School of Engineering and Technology, Sharda University, Greater Noida.
Corresponding Author E-mail: pankajtnj@yahoo.com
DOI : http://dx.doi.org/10.13005/bbra/2516
ABSTRACT: Chlorella pyrenoidosa from National Collection of Industrial Microorganism (NCIM) Pune, India and that from Department of Biotechnology, University of Nigeria Nsukka (UNN) were cultivated using Fog’s media. The two samples in Erlenmeyer conical flasks were incubated at temperature of 280C at 12hrs. Photo and 12hrs dark periods at 2500 Lux using light from fluorescent tubes. The cultivation was carried out for the period of 30 days. The growth rates were assessed using spectrophotometer at wave length of 660nm at 7days interval. The result of the assessment showed that Chlorella pyrenoidosa from NCIM Pune, India had initial optical density (O.D.) of 0.1024 while that from UNN Nigeria was 0.0956, while the final India sample was 1.0462 and that from Nigeria was 0.788 respectively. The result of cell count using Neubauer hemocytometer showed that Cfu for C. pyrenoidosa from India was 1.8 x 10⁶ while that from Nigeria was 1.0 x 10⁶ per ml respectively. Total Chlorophyll was equally determined using 80% acetone as solvent that from Pune, India had a mean of total Chlorophyll of 12.42µg/ml while that from Nigeria 12.22µg/ml respectively. All the result obtained were subjected statistical using t-test and they showed significant different between India specie and Nigeria, since t cal< t tab at (P< 0.05). The growth rate measured with spectrophotometer showed that the Indian sample had higher O.D. than Nigerian which may be due to Temporal, environmental genetic acclimatization changes and local geological condition can also be the reason for variations between the same species from different region Temperate India and Tropical Nigeria.
KEYWORDS: Chlorella pyrenoidosa; Fog’s media; Food Supplement optical density; Spectrophotometer;
Download this article as:| Copy the following to cite this article: Christian O, Majumder S, Taneja P. Growth Characteristics of Indian and Nigerian Chlorella Pyrenoidosa used as food Supplement. Biosci Biotech Res Asia 2017;14(2). |
| Copy the following to cite this URL: Christian O, Majumder S, Taneja P. Growth Characteristics of Indian and Nigerian Chlorella Pyrenoidosa used as food Supplement. Biosci Biotech Res Asia 2017;14(2). Available from: https://www.biotech-asia.org/?p=24910 |
Introduction
In developing countries, countless individuals are suffering from malnutrition not due to lack of food, but due to inadequate nutritionally rich food resulting in various health problems.1 India is the second most populated country of the World with its population of over 1.2 billion and Nigeria the tenth with over 180 million people and about 50% of population suffering from malnutrition. Algae are important source of vitamins, proteins, polyunsaturated fatty acids (PUFA) and antioxidants which can be used as food supplement.2,3,4,5 Quantifying phytoplankton is usually done by time consuming methods, such as direct cell counts under microscope or measurements of cellular mass or volume, Chlorophyll content measurement, and absorbance or turbidity numerical correlations.6 Cell counting is a direct measurement procedure used to determine the concentration of many microorganisms including unicellular green algae. According to Madigan and Martinko7 cell counting has several limitations including dead cells cannot be distinguished from live cells without staining methods. Mohan et al,8 also measured Chlorella vulgaris concentration by cell counting using Neubauer hemocytometer. Cell counting is very time consuming because limited number of samples can be analyzed. Cell counting is a subjective test that is influenced by how individuals distinguish algae solids from non-algae solids. According to Becker9 cell counting by microscopic methods should be used for qualitative estimations rather than quantitative estimations.
Another method to evaluate algae concentration is by dry weight method. Aliquots of algae are placed in metal dishes and dried in a convection oven overnight.10 The quantity of ash is determined by placing algae sample in a glass fiber filter, drying in a furnace at 5400C for 4 hours. This process has interference with organic solids, is expensive and time consuming.11 Another method used to estimate plankton density in nature is the fluorometry. This measurement is based on the capacity of Chlorophyll molecules fluoresce, where the Chlorophyll absorbs light at one wavelength and emit light at a longer wavelength.12 Thomas and Flight13 found that measurements of vivo chlorophyll concentration by fluorescence were about 10 times less efficient than measuring extracted Chlorophyll from concentration.
Optical density is an indirect method in which absorbance of light within a sample is measured. Wang et al,14 measured the algae growth rate (GR) as a function of the optical density at 680nm at time Zero and optical density at 680nm on day ‘t’ (ODt). The result is more realizable and not time consuming. Environmental factors such as temperature, light, pH and nutrients not only affect photosynthesis and growth rate of the algae, but also influence the activity of cellular metabolism and composition.15,16,17 The main objective of this study was to investigate the growth characteristic of Indian and Nigerian Chlorella pyrenoidosa for food supplement.
Materials and Methods
Algae Collection
The green algae for this studies C. pyrenoidosa (NCIM No. 2738) was obtained from National Collection of Industrial Microorganism (NCIM) Resource Centre Pune, India and Department of Biotechnology, University of Nigeria, Nsukka, (UNN) with algae number (UNN C212).
Preparation of Culture Medium
The preparation of culture medium was done in Fog’s media18 with the following composition for 1.0 liter of culture medium: – 2.0 g of KNO3, 0.2 of MgSO4.7H2O, 0.2 of K2HPO4, 0.1 g of CaCl2.H2O, 5.0 ml solution of Fe-EDTA made from Fe-EDTA= Na2EDTA= 745 mg and FeSO4.7H2O= 557 mg in 100 ml of distilled water which was boiled to dissolve after which only 5.0 ml was added to the main medium. 1.0 liter of distilled water was added to the main medium. Furthermore micronutrient composition consists of 2.86 g of H3BO4 , 1.81 g of MnCl2.4H2O, 0.222 g of ZnSO4.7H2O, 0.39 g of Na2MoO4.2H2O and 0.08g of CuSO4.5H2O dissolved in one litre of distilled water to make a stock solution. 1ml of this stock solution was added to 1 litre of main media of macronutrients. The pH of media was adjusted to 7.5 with 1N NaOH before it was autoclaved and then cool for inoculation.
Inoculation and Incubation
Into 5 Erlenmeyer conical flasks of 250ml for each, 50ml of fog medium was added and inoculated with 3 loopful (1×10³cfu) using wire loop of specie of Chlorella pyrenoidosa collected from NCIM Pune, India (NCIM 2738) and Nigeria (UNN C212) from the agar slant culture tubes from various sources respectively. The samples were incubated at 280C at 12hrs light and 12 hrs dark periods at 2500 Lux (see Fig. 1. below). The algae maintained for the periods of 30 days.
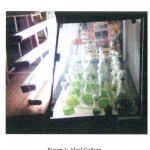 |
Figure 1: Algal Culture
|
Growth Rate Estimation with Spectrophotometer
The growth rate was monitored at 7days interval using Labronics model LT – 290 Microprocessor UV – VIS spectrophotometer (Single Beam) at wave length of 660nm. The quartz corvette was first filled with distilled water and set as blank and later the optical density of each sample was measured at 660nm. The observation was recorded in triplicate.
Cell Counting of Algae Samples
Cell counting of algae samples were done using light microscope and Nebauer hemocytometer and the morphology of pure strains were regularly examined under an optical microscope and observed at 100X and photographed with fluorescent microscope. The micrograph shown in Fig. 4.
Estimation of Chlorophyll a, b and Total Chlorophyll of Algae Samples
Total Chlorophyll of algae samples were extracted with 80% Acetone and absorbance at 663nm and 645nm with spectrophotometer using the absorption coefficients and the amount of Chlorophyll was calculated based on Arnon,19 which is as follows:- 10mg each of dried algae samples from Pune, India and UNN Nigeria was weighed and added into each clean mortar and pestle. Each was ground to a fine pulp with the addition of 2.0ml of 80% acetone. It was later placed into eppendorf tubes and centrifuged at 5000 rpm for 5min and transferred the supernatant to a 100ml volumetric flask. The pellet was later ground with 2.0ml of 80% acetone, again centrifuged and transferred the supernatant to the volumetric flask. The procedure was repeated until the pellet / residue is colorless and the mortar and pestle washed thoroughly with acetone and the washings collected into the volumetric flask made up with 80 % acetone to 10.0ml. Absorbance of the extracted solution was read at 645, 663 and 652n, against the solvent (80% acetone) blank. Calculation was done with the following formula:-
Ch – a = 12.25 A663 – 2.79A645
Ch – b = 21.5A645 – 5.1A663
Equation to determine concentration (µg/ml) of Chlorophyll-a (Ch – a) Chlorophyll – b (Ch – b) 20, 21, 22. A at respective absorbance.
Statistical Interpretations
The tests were subjected to statistical analysis using student t – test.
Results and Discussions
Growth Rate Estimation With Spectrophotometer
The growth rate was recorded in identical condition. The O.D. at 660nm on initial day after inoculation for sample from UNN Nigeria was found to be 0.0956 while after 28days it was found to be 0.7886. For the sample from NCIM Pune, India O.D. at 660nm on initial days after inoculation was found to be 0.1024 and 1.0462 after 28 days of incubation. The results of O.D were plotted on a graph Fig.2 below:
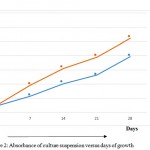 |
Figure 2: Absorbance of culture suspension versus days of growth
|
Subjecting the results of O.D obtained for C. pyrenoidosa collected from India and UNN Nigeria statistically using t-test as shown on Table 1.
To find the mean for C. pyrenoidosa from (NCIM) Pune, India
x̅1 = 5.231/5=1.046
To calculate the standard deviation S12 we use the formula

Where
S12 = Standard Deviation
Σ = Summation
x1 = Value of item of O.D
x̅1 = Value of mean
n = Total number of scores
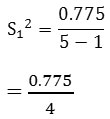
S12 = 0.194
To find the mean for C. pyrenoidosa (UNN) Nigeria
x̅2 = 3.938/5
= 0.788
To calculate the standard deviation
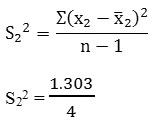
= 0.326
Since n<30 and the parameters involved are means, t-test is applied. Hence, t value is calculated from sample data from the relationship

Where,
t = student t-test
x̅1 = Mean for Indian
x₂ = Mean for Nigerian
S12 = Standard Deviation for Indian
S22 = Standard Deviation for Nigerian
Substituting from the formula
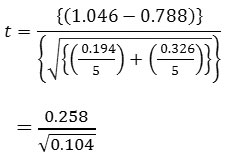
= 0.801
tcal = 0.801
From statistical table, the critical value of t for α/2= 0.025 and d.f (degree of freedom) = 4 is ttab = 2.7764. (Note α/2 because the test is two tail test) since tcal < ttab, the null hypothesis (Ho) that is x̅1 = x̅2 is rejected and the alternative Hypothesis (H1) that is x̅1≠ x̅2 is accepted.
This implies that there is a significant difference between the two sets of data (P<0.05) for Indian and Nigerian C. pyrenoidosa respectively.
Table 1: O.D (Optical density) at 660nm Growth Rate
| X1 NCIM Pune, India | (X1 – 1) | (X1 – 1)2 | X2 UNN Nigeria | (X2 – 2) | (X2 – 2)2 |
| 1.356
1.486 0.538 0.611 1.240 |
0.310
0.440 -0.508 -0.435 0.194 |
0.096
0.194 0.258 0.189 0.038 |
1.654
1.075 0.360 0.317 0.532 |
0.866
0.287 -0.428 -0.471 -0.256 |
0.750
0.082 0.183 0.222 0.066 |
| Total 5.231 | 0.775 | 3.938 | 1.303 |
Cell Counting Using Neubauer Hemocytometer
The result of cell count using Neubauer hemocytometer showed that the cfu for C. pyrenoidosa from Pune, India was 1.8 x 10⁶ while that from UNN Nigeria was 1.0 x 10⁶ per ml respectively. The graph for O.D versus cell per ml was shown on Fig. 3 below. Furthermore from the graph of O.D. Versus cells per ml it showed that as the O.D increases the cells per ml equally increases. Therefore this indicates that O.D. was proportional to cells per ml.
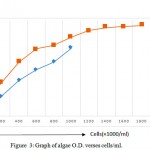 |
Figure 3: Graph of algae O.D. verses cells/ml.
|
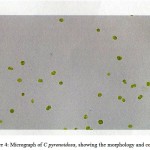 |
Figure 4: Micrograph of C pyrenoidosa, showing the morphology and count.
|
Estimation of Chlorophyll a, b and Total Chlorophyll
Estimation of Chlorophyll for the two samples of C. pyrenoidosa from India and Nigeria were done and result of absorbance got recorded at respective O.D as in Table 2.
Table 2: O.D. (Optical density) of Chlorophyll Extract)
| Samples | Absorbance
645nm |
Absorbance 663nm |
| C. pyrenoidosa UNN Nigeria
C. pyrenoidosa Pune, India |
0.347
0.356 |
0.799
0.807 |
To calculate Ch – a (Chlorophyll – a) for UNN Nigeria
Substitute from the formula
Ch – a = 12.25 A663 – 2.79 (A645)
= 12.25 x 0.799 – 2.79 (0.347)
= 8.82 µg/ml
Ch – b (Chlorophyll – b)
= 21.5 A645 – 5.1 A663
= 21.5 x 0.347 – 5.1 x 0.799
= 3.4 µg/ml
For Pune India
Ch – a = 12.25 x 0.807 – 2.79 x 356
= 8.892 µg/ml
Ch – b = 21.5 A645 – 5.1 A663
= 21.5 x 0.356 – 5.1 x 0.807
= 3.534 µg/ml
The Chlorophyll estimation with 80% Acetone got tabulated at Table 3.
Table 3: Chlorophyll Estimation
| Sources of Material | Ch – a µg/ml | Ch – b µg/ml | Total a + b µg/ml |
| C. pyrenoidosa India
C. pyrenoidosa Nigeria |
8.89
8.82 |
3.53
3.40 |
12.42
12.22 |
With the mean of = 12.42 for Total Chlorophyll from NCIM Pune, India and = 12.22 for UNN Nigeria and from the result of five data respectively the data were subjected to statistical analysis using student t – test as test statistic at α = 0.05 and d.f = 4. This yielded tcal = 0.674 and t tab = 2.776. Since tcal<ttab the difference in Chlorophyll content of the two are significant at (P< 0.05).
pyrenoidosa collected from (NCIM) National collection of Industrial Microorganism Pune, India has produced higher O.D (Optical Density) than the one from Department of Biotechnology University of Nigeria Nsukka (UNN). Equally from the result of the experiment the specie from NCIM Pune, India had higher cell density count and Chlorophyll contents than that from UNN Nigeria. These indicates that for India isolates the experiment conditions were optimum and will be a better isolate to work in this condition. The various variations in growth rate, cell count and chlorophyll contents may be as a result of genetic acclimatization to environment from one region of the World and another (India being Temperate and Nigeria being Tropical region). Variation in leaf pigments (Chlorophylls and carotenoids) and its relation can be due to internal factors and environmental conditions. Shaikh and Dongare23 reported that Chlorophyll and Carotenoids content varied with microclimatic conditions in Adiantum species. The variation in the growth rate may be due to changes in environmental factors as reported by15,16,17 that environmental factors such as temperature, light pH and nutrients not only affect photosynthesis and growth rate of the algae but also influence the activity of cellular metabolism and composition since they are from different environments that may be the reasons for different growth rate exhibited by the same species of algae. Temporal seasonal changes, local geological condition and genetic changes in specie can also be the reason for variations in pigment concentration, therefore further study in this context is recommended.
Conclusions
We have concluded that Indian algae had a better growth rate, cell count and Chlorophyll content than that of Nigerian and therefore it would be recommended that the isolate from Indian should be used for mass production purposes as a food supplement to fight malnutrition in both countries.
Acknowledgements
This research work was supported by Tetfund Nigeria sponsorship for Staff Development. I am grateful to Prof. Rita Singh Majumdar Head of Department of Biotechnology, Sharda University, Greater Noida for approval of use of Laboratory for the work. I am equally grateful to NCIM Pune, India and UNN Nigeria for supplying us with culture.
Conflict of Interest
The author(s) have not declared any conflict of interest.
References
- Singh S., Kate B. N., Banerjee U. C. Bioactive compounds from overview. Critical reviews in Biotechnology. 2005;25(3):73 – 95.
CrossRef - Pulz O and Gross W. valuable products from Biotechnology of microalgae. Applied Microbiology, Biotechnology 2004;65(6):635– 648.
CrossRef - Svircew Z. Mikroalgaricijanobreije U biotechnology. Nov. Sad Prirodna_Matenaticki Fakwitet. 2005.
- Bazencic J. Sistematikaalgi, Beograd: NNK. International. 2007.
- Gouveia L., Batista A. P., Sousa I., Raymund A., Bandaria N. M. Microalgae in novel food products in K. Papadopoulos food chemistry research development Nova Science Publishers. 2008;75–112.
- EPA Environment protection Agency united states. Short – term methods for measuring the chronic toxicity of effluents and receiving waters to fresh water organisms. 3rd edition, Cincinato, Ott : US, EPA. 1994;600(2):4-91.
- Madigan M. T., Martinko J. M. Brock Microbiology at Microorganisms Southern Illinois University Carbondole Pearson Prentice Hall. 2006;12.
- Mohan N., Hanumantha P. R., Ranjith R. K., Sivsankarar S and Sivasubramanian V. Studies on mass cultivation of Chlorella vulgaris and effective harvesting of biomass by low cost methods. Journal Algal Biomass. 2009;1(1):29-39.
- Becker E. W. Microalgae Biotechnology and Microbiology. Cambridge University Press New York. 1994.
- Liang Y.,Sarkany N.,Cui Y. Biomass and Lipid productivities of Chlorella vulgaris under autotrophic heterotrophic and mixotrophic growth conditions. Biotechnology letters. 2009;31(7):1043–1049.
CrossRef - Zhu C. J and Lee Y. K. Determination of biomass dry weight of marine microalgae. Journal of applied Phycology. 1997;9:189–194.
CrossRef - Lorenzen C. J. A method for the continuous measurement of vivo chlorophyll concentration Deep – Sea Res. 1966; 13:223–227.
- Thomas J. B and Flight W. F. G. Fluorescence response of Chlorophyll Biochim. Biophs. Acta. 1964;79:500-510.
- Wang L., Min M.,Li Y., Chen P., Wang Y and Ruan R. Cultivation of Green Algae Chlorella In different waste waters from municipal waste water treatment plant. Appl. Biochem. Biotechnology. 2009;162(4):1174-1186.
- Morris L.,Glover H., Yentsch C. Products of photosynthesis by marine phytoplankton: The effect of environmental factors on the relative rates of protein synthesis. Biol. 1974;27:1–9.
CrossRef - Thompson P. A., Guo M., Harrison. 1 On the biochemical composition of eight species of marine phytoplankton. Journal phycol. 1992;28:481-488.
CrossRef - Kilham S., Kreeger D., Goulden C., Lynn S. Effect of nutrient limitation on biochemical constituents of Ankistrodesmus falcatus. Fresh. Biol. 1997;38:591–596.
CrossRef - Fogg G. E. Algal culture and Phytoplankton Ecology” The University of Wisconsin Press, Wisconsin. 1975.
- Arnon D. I. Estimation of Chlorophyll a, Chlorophyll b and total chlorophyll of the plants / Algae. Plant Physiology 1947;24:1.
- Porra R. J.,Thompson W. A and Kreidemann P. E. Determination of accurate extinction coefficients and simultaneous equations for assaying chlorophylls a and b extracted with four different solvents verification of the concentration of chlorophyll standards of atomic absorption spectrometry. Biochem. Biophs. Acta. 1989;975:348-394.
- Lichtenthaler H. K. Chlorophylls and Carotenoids: Pigments of Photosynthesis membranes method. Enzymol. 1987;148:350–382.
CrossRef - Lichtenthaler H. K and Wellburn. Carotenoids and chlorophylls a and b of leaf extracts in different solvents Biochem. Soc. Trans. 1983;11:591–592.
CrossRef - Shaikh S. D and Dongare M. Analysis of Photosynthesis pigments in Adiantum lunulumilatum Burn. At different localities of Sindhudurg District (Maharashtra). India Fern. J. 2008;25:83-86.

This work is licensed under a Creative Commons Attribution 4.0 International License.


