How to Cite | Publication History | PlumX Article Matrix
Krityanand Kumar Mahatman1,3, Rupesh Deshmukh1, Anshuman Tiwari1, Mahesh Chandra Yadav2, Jyoti Kumari3 and Satish B. Verulkar1
1Department of Plant Molecular Biology and Biotechnology, College of Agriculture, Indira Gandhi Agricultural University, Raipur-492006, CG, India.
2Division of Plant Genomic Resources, National Bureau of Plant Genetic Resources, Indian Council of Agricultural Research (ICAR), PUSA, New Delhi-110012, India.
3Division of Germplasm Evaluation, National Bureau of Plant Genetic Resources, Indian Council of Agricultural Research (ICAR), PUSA, New Delhi-110012, India.
Corresponding Author E-mail: krityabt@gmail.com
DOI : http://dx.doi.org/10.13005/bbra/2519
ABSTRACT: With the substantial increase in food grain production, much of the emphasis has been put for enhanced grain quality traits. Most of the grain qualities traits are polygenic in nature. Identification of QTLs and markers linked to these QTLs can substantially enhance the selection efficiency. In this study, an effort has been made to identify QTLs for these traits. For this purpose two mapping population, RIL Safri17 x Kranti and DH population CT-993-5-10-1-M and IR 62266-42-6-2 were used and evaluated under field conditions. DNA from 112 lines of RIL was extracted, quantified and diluted to the appropriate concentration for PCR-based amplification. Fifty markers were used for detecting parental polymorphism. Five markers exhibiting polymorphism were further used for developing marker profile on the complete set of RIL. This data along with genotyping data for this population was used for QTLs analysis using single marker ‘t’ test. RM 110, RM 202 and RM 212 were associated with grain length, RM 84 and RM 539 was associated with grain width, and RM 163, RM 202, RM 247 and RM 80 were associated to be L/B ratio. For DH population MAPMAKER/ QTL 1.1 was used for interval mapping and to estimate the percentage of total phenotypic variation. A threshold of LOD> 2.4 was used per test to claim the presence of QTL. A total of 8 QTLs were detected for grain width and grain L/B ratio. For grain width 3 QTLs detected on chromosome number 2, 3, 6 which shows 11 percent phenotyping variation. For L/B ratio 5 QTLs were detected, which were present on chromosome 2 3, 6 having 9 to 12.5 percent phenotypic variation. For grain length no QTLS detected.
KEYWORDS: Grain Length; Grain Width; Grain L/B ratio;Rice; QTLs
Download this article as:| Copy the following to cite this article: Mahatman K. K, Deshmukh R, Tiwari A, Yadav M. C, Kumari J, Verulkar S. B. Identification of QTL associated with grain length, grain width and L/B ratio in double haploid and recombinant inbred line population in rice (Oryza sativa L.). Biosci Biotech Res Asia 2017;14(2). |
| Copy the following to cite this URL: Mahatman K. K, Deshmukh R, Tiwari A, Yadav M. C, Kumari J, Verulkar S. B. Identification of QTL associated with grain length, grain width and L/B ratio in double haploid and recombinant inbred line population in rice (Oryza sativa L.). Biosci Biotech Res Asia 2017;14(2). Available from: https://www.biotech-asia.org/?p=26099 |
Introduction
Rice is the most important food crop for nearly half of the world’s population depended on for energy on it (Sellamuthu et al., 2011). Rice is a one of the most nutritious cereal crop, which used mainly for human consumption. It is the main source of energy and is an important source of carbohydrate, protein, minerals providing substantial amounts of the recommended nutrient intake. Rice protein is biologically the richest by virtue of its high true digestibility (88%) among cereal proteins and also provides minerals and fiber. Calories from rice are particularly important for the poor accounting for 50-80% of the daily caloric intake. Rice can also be used in cereals, snakes, beverages, oil (rice bran oil), syrup, medicinal and religious ceremonies. In 2013, rice was cultivated in 124 countries, with the corresponding worldwide production of 745 million tons (FAOSTAT). It is one of the most versatile crops cultivated worldwide as it is grown under a wide range of agro-climatic conditions ranging from irrigated, rainfed lowland, rainfed upland and flooding ecosystems. It is estimated that rice production must increase by at least 40 percent during the next 25 years to meet ever increasing demands. This calls for the development of rice varieties with higher yield potential, tolerance to biotic and abiotic stresses and superior grain quality. In the evolution of rice and genetic differentiation into a distinct varietal group, consumer quality preference has played a significant role besides, agro-ecological factors. Among the various quality traits, grain length, grain width, and L/B ratio are important among the consumers. For simply inherited traits controlled by single genes with major effects, the selection can be made by traditional breeding methods. However, plant breeders are often confronted with problems when trying to improve a trait that is controlled by many genes through traditional breeding methods. in rice breeding, most agronomic and grain quality traits are controlled by many genes each of which has a relatively small effect on the overall phenotype.
Quantitative traits are difficult to study because the phenotypes do not give an insight into the genotype. The expression of genes controlling quantitative traits can be greatly influenced by the environment (Lynch and Walsh, 1998). Consequently, the improvement of polygenic traits by traditional breeding methods is time-consuming and the gains are harder to realize. Because of the intractable problem encountered while trying to improve quantitative traits by conventional means, breeders and geneticists have considered the potential use of DNA markers to identify chromosomal region harboring genes that influence the quantitative traits. Although the principles of QTL analysis were first outlined and successfully applied in the early 1920s to map a QTL for seed size in bean tightly linked to a gene controlling seed pigmentation (Sax, 1923), a wide-scale application of QTL analysis was not possible at that time due to the paucity of genetic markers available. The systematic identification and characterization of QTLs were finally made possible more than 50 years later, following the introduction of the first class of molecular markers (restriction fragment length polymorphisms, RFLPs) suitable for an adequately detailed genome-wide survey (Botstein et al., 1980). The time-consuming process of map construction was considerably shortened with the introduction of PCR-based microsatellite (SSR, simple sequence repeat) markers, particularly suited for mapping purposes due to their high level of polymorphism (Taramino and Tingey, 1996). In principle, once QTLs have been identified, introgression of the favorable alleles and their pyramiding into elite germplasm (e.g. parental lines, population, etc.) becomes possible through marker-assisted selection (MAS) (Ribaut and Hoisington 1998; Stuber 1999; Young 1999).
Considering these facts a recombinant inbred line (RIL) population between Safri-17 x Kranti and DH population between CT9993-5-10-M X IR62266-42-6-2was used in the present investigation. This population exhibit segregation for a number of grain quality including length, width, and L/B ratio. Since the identification of QTL requires the genotypic data of molecular markers thus an attempt was made in the present investigation to develop microsatellite marker data on the RILs population and identification of QTLs for grain quality including length, width, and L/B ratio.
Material and Methods
Planting Materials and Field Experiments
The two populations (144 lines of DH and 112 lines of RIL) were planted in the field for recording observation during the wet season. The seeds were sown in nursery and transplanting was done in the month of August. The plant to plant and row to row spacing was at 20 cm. Each line was sown in a single row of 3 m, with 2 replications. The same material was sown under two situations well watered and water stress conditions. However, water stress could not be imposed due to continuous rain. Normal package of practice was followed and all care was taken to raise a good crop. After harvesting following observations were recorded, measured the grain length of 20 samples (in millimetrr), grain width of 20 samples (in millimeter) from the rice grain. L/B ratio measured by calculating grain length to grain width ratio.
Genotypic Data
For developing the genotypic data based on SSR markers, the Safri-17 x Kranti population was used. DNA was extracted by CTAB miniprep methods. 7 ml of DNA sample from stock was diluted with 35 ml of double distilled water, 10 ml of this diluted DNA was loaded on 0.9 percent agarose gel and electrophoresis was done for about 2 hours at the constant current of 50 volts. The gel was observed on UV-transilluminator and picture was recorded on a gel documentation system. 5 ml of DNA from stock was diluted up to 20 times using 95 ml of double distilled water (nanopore).The diluted DNA was subsequently used for PCR amplification. PCR reactions were performed in the total volume of 20 ml reaction volume containing PCR buffer 1X with 1.5 mM MgCl2, 0.1mM dNTPs, 0.125 mM of each primer, 3U Taq polymerase and 40 ηg of genomic DNA as a template. After an initial denaturing step of 4 min at 94°C, 35 cycles were performed for 1 minute at 94°C, 55-60°C (depending on Tm value specific primers) for 1 minute and 72°C for 2 minutes, with a final extension at 72°C for 5 min.
The primer exhibiting polymorphism on parents was further used for PCR amplification on all the 112 recombinant inbred lines. Genotypic data were generated with a set of 5 polymorphic primers. The primer used for this purpose is listed in Table 3. PCR amplified SSR product was (mixed with 10x loading dye and loaded on 5 per cent horizontal polyacrylamide gel (Kotasthane personal communication) prepared in 1x TBE buffer along with 1Kb plus ladder. Electrophoresis was done for 2 hours at 250 volts. Gels were visualized on UV transilluminator and photographed by using BIO-RAD gel documentation system. Scoring of SSR banding pattern in population was code A for the female parent, B for male parent and H for both male and female band (heterozygote).
Statistical Analysis
The field data recorded for two traits viz. Grain Length, Grain width, and L/B ratio were analyzed using ANOVA. For QTL analysis in DH population, MAPMAKER / QTL 1.1 was used for interval mapping (Locating the marker between flanking molecular marker by maximum likelihood estimation) (Lander et al., 1987) and to estimate the percentage of the total phenotypic variance explained by each QTL. A threshold of LOD > 2.4 was used per test to claim the presence of a QTL. For single marker analysis, ‘t‘ test was used for association of markers with QTLs.
Results and Discussion
In the present study RIL population along with DH population was evaluated under the field condition. This population segregates for a number of quantitative and qualitative traits including grain characteristics. Simultaneously an effort was made to develop genotypic data of the RIL population based on microsatellite marker. The genotypic data is used for identifying the association of this marker with the traits of interest and to compare the results of this study with another.
Analysis of variance
Both the population i.e. 112 RIL and 144 DH population were evaluated under field conditions during wet season 2003. The genotypes were planted in the completely randomized block design with two replication. The observation was recorded on 20 seeds/plant for three quantitative traits on randomly selected 5 plants. The analysis of variance revealed that in both the populations all of the traits showed significant variance. This indicates that genotype differed from each other for all the traits under study table 1. These results were expected as parents of both the population differ from most of the grain quality traits.
Table 1: Variation in traits
| Sr. No. |
Characters | Parents | RIL
Population |
Range | Average | SD | ||
| Safri-17 | Kranti | MAX | MIN | |||||
| 1 | GL | 8.0 | 5.8 | 10.0 | 4.3 | 5.7 | 8.525 | 0.41 |
| 2 | GW | 2.4 | 2.8 | 3.4 | 2.3 | 1.1 | 2.85 | 0.21 |
| 3 | L/B | 3.33 | 1.81 | 3.89 | 2.45 | 1.44 | 3.0 | 0.2 |
| CT9993- 5-0-1M |
IR62266- 42-6-2 |
DH
Population |
||||||
| 1 | GL | 7.72 | 8.62 | 9.90 | 7.60 | 2.30 | 8.71 | 0.46 |
| 2 | GW | 2.63 | 2.13 | 2.70 | 2.00 | 0.70 | 2.26 | 0.15 |
| 3 | L/W | 2.93 | 4.04 | 4.71 | 3.08 | 1.64 | 3.86 | 0.34 |
Nature of Inheritance
The progeny of crosses between parent differing in quantitative traits typically exhibits phenotypes ranging between those of the parents. The nature of the progeny distribution is determined jointly by the number of genes which account for the difference between the parents, together with the effects of non-genetic factors, such as microenvironmental differences and measurement error. Classical polygenic traits influenced by the virtually infinite number of genes, each with tiny effect exhibits a typical normal distribution. The almost normal distribution indicates that the traits under consideration i.e. grain length; grain width and L/B ratio are typically polygenetic in nature.
Table 2 shows the average length, width, and L/B ratio value for the both the parents and RILs and DH population. Safri-17, the female parent in RIL population had longer grain while Kranti falls under the category of short grain. The average grain length for 112 RIL lines was 8.5 mm; standard deviation was, 0.4 mm with a range of 5. 7 mm. The maximum grain length observed was 10 mm while the minimum was 4.3 mm. These higher and lower values in the segregating population compared to parents indicated transgressive segregation in both the direction.
Table 2: ANOVA Table for RBD design
| RIL POPULATION | ||||
| Source of variation | Degree of Freedom | Mean sum of squares | ||
| Grain length | Grain width | L/B ratio | ||
| Replication | 1 | 5.07** | 4.06** | 3.42** |
| Genotype | 111 | 1.29** | 0.99** | 1.42** |
| Error | 111 | 0.32 | 0.21 | 0.29 |
| DH POPULATION | ||||
| Source of variation | Degree of Freedom | Mean sum of squares | ||
| Grain length | Grain width | L/B ratio | ||
| Replication | 1 | 9.08** | 7.82** | 4.56** |
| Genotype | 143 | 4.25** | 4.44** | 5.23** |
| Error | 143 | 1.01 | 0.96 | 1.07 |
** – Significant at 1 per cent of significance
The average grain width for all 112 lines was 2.8 mm; standard deviation was 0.21 mm, with the range of 1.1 mm. The maximum grain width recorded was 3.4 mm while the minimum grain width was 2.3 mm. For this trait also transgressive segregation was observed. The average grain L/B ratio for all 112 lines was 3.00 standard deviation was 0.2. The maximum L/B ratio was 3.89 while the minimum was 2.45. The transgressive segregation observed indicate the distribution of genes in parents for these traits.
In the DH population between CT9993 and IR 62266, female parent is a japonica type with shorts and bold grain while IR 62266 is an indicia type and has relatively long and slender grain. The average grain length (GL) of DH population was 8.71 mm; standard deviation was, 0.46 mm with a range of 2.30 mm. The maximum GL observed was 9.90 mm while the minimum was 7.60 mm.
The average grain width for all 144 lines was 2.26 mm standard deviation was 0.15 mm, with the range 0.70 mm. The maximum grain width recorded 2.70 mm while the minimum grain width was 2.00 mm. For this trait also transgressive segregation was observed. The average grain L/B ratio for all lines was 3.86, the standard deviation was 0.34 mm. The maximum L/B ratio was 4.71 while the minimum was 3.08. For all the traits studied, all of them exhibited transgressive segregation. The transgressive segregation observed indicate the distribution of genes in parents for these traits, and provide an excellent opportunity for selection. The nature of inheritance was studied for three characters in both the DH and RIL populations. The distribution of individual lines for each character was graphically plotted to assess the symmetry and continuity of distribution in fig 1. Segregation of metric characters, as a rule, exhibits the symmetry and the continuity appropriate to a normal distribution (Tripathy et al., 2000).
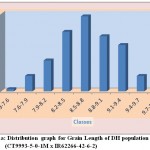 |
Figure 1a: Distribution graph for Grain Length of DH population (CT9993-5-0-1M x IR62266-42-6-2)
|
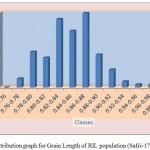 |
Figure 1b: Distribution graph for Grain Length of RIL population (Safri-17x Kranti)
|
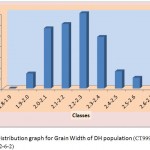 |
Figure 1c: Distribution graph for Grain Width of DH population (CT9993-5-0-1M x IR62266-42-6-2)
|
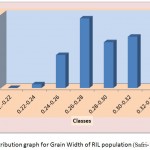 |
Figure 1d: Distribution graph for Grain Width of RIL population (Safri-17x Kranti )
|
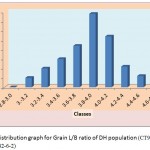 |
Figure 1e: Distribution graph for Grain L/B ratio of DH population (CT9993-5-0-1M x IR62266-42-6-2)
|
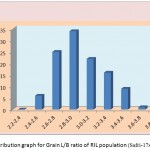 |
Figure 1f: Distribution graph for Grain L/B ratio of RIL population (Safri-17x Kranti)
|
The segregation pattern of all the character followed near normal distribution. Such characters which exhibit normal distribution are usually under the control of numerous polygenes, while individual’s effect is small and cumulate adaptively and the expression is profoundly influenced by the environment. This was as per our expectations as the characters chosen for the study are known to be quantitative in nature (Yano et al. 1997). Thus, the population cannot be classified into discrete classes. Therefore, its inheritances cannot be followed through the simple Mendelian ratios. The slight deviation from normal distribution could be because of iso-directional dominance or may be the geometric gene action. Different type of gene interactions have been reported (Singh et al., 1980; Rohman et al., 1981; Haque et al., 1981; Cheema, 1988) for these traits. The transgressive segregation observed for all the traits could be resultant of unequal distribution of alleles with positive and negative effects, along with difference type of gene interaction (Haque et al., 1981; Cheema, 1988).
SSR Assay
The PCR protocol for SSR was standardized using various concentrations of primers, template DNA, and Taq polymerase along with annealing temperature. Initially, SSR assay produced multiple bands, which later optimized to produce single band however still some primer produced multiple bands.
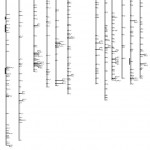 |
Figure 2a: QTLs position for the grain length of Double Haploid Population (CT9993-5-0-1M x IR62266-42-6-2)
|
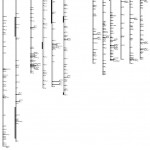 |
Figure 2b: QTLs position for the grain width of Double Haploid Population (CT9993-5-0-1M x IR62266-42-6-2)
|
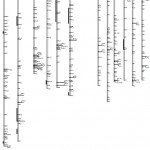 |
Figure 2c: QTLs position for the grain L/B ratio of Double Haploid Population (CT9993-5-0-1M X IR62266-42-6-2)
|
Once the PCR protocol for SSR assay was standardized, it was used for all subsequent studies. The DNA of all the 112 lines were subjected to PCR-based simple sequence repeat (SSR) technique to generate genotypic data using rice microsatellites (RM) primers.
SSR-based Population Analysis
The differences in the amplified fragment were good enough to be resolved by 5 per cent horizontal gel electrophoresis. Individually as expected for all the microsatellite markers Safri and Kranti type allele’s ratio of 1:1, except RM 110. The two markers RM 163, RM 164 has been reported to be present on the same chromosome. The c2 test for the independence there two markers indicates that the marker is closely linked. The SSR markers are co-dominant and the presence of both the bands indicates heterozygosity. A few linear do exhibit presence of both the bands. So there is a residual heterozygosity.
Most of the genotypic data only one band either marker like Safri or Kranti was obtained. The SSR markers are co-dominant, which indicated that all most all are homozygous. Few heterozygous were also observed which are higher than expected as per the predicted value of homozygous for F8 population (Allard, 1960). The SSR marker-based genetic linkage map developed by McCouch et al. (2001) was used to assign the location of marker used in this study.
QTL Analysis
For QTL analysis both the population viz. DH population and RIL population were evaluated in the field for grain quality traits. The genotypic data of 315 markers is already available for DH population, this data set was used for QTL analysis using interval mapping. While the single marker analysis (t-test) was done for QTL analysis in Safri-17 x Kranti RIL population.
MAPMAKER/QTL 1.1 was used for QTLs analysis of grain length, grain width and L/B ratio. The mean data of both the replication were subjected to analysis. A threshold level of LOD > 2.4 was used to claim the presence of QTL. The relative position and length of QTL are presented in fig 3 and the amount of phenotypic variation explained by each QTL is presented in Table 3.
Table 3: SSR primers used for population studies
| Sr. No. | Primer | Sequence (F) | Sequence (R) |
| 1 | RM110 | tcgaagccatccaccaacgaag | tccgtacgccgacgaggtcgag |
| 2 | RM163 | atccatgtgcgcctttatgagga | cgctacctccttcacttactagt |
| 3 | RM164 | tcttgcccgtcactgcagatatcc | gcagccctaatgctacaattcttc |
| 4 | RM206 | cccatgcgtttaactattct | cgttccatcgatccgtatgg |
| 5 | RM280 | acacgatccacttgtcgc | tgtgtcttgagcagccagg |
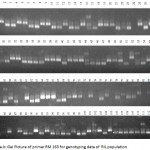 |
Figure 3a.b: Gel Picture of primer RM 163 for genotyping data of RIL population
|
For grain length with the threshold of >2.4 LOD, this character no scorable QTLs was identified. For grain width 3 QTLs were identified. One QTLs with LOD score 3.57 was detected between marker RG 437 & ME 10_18 on chromosome #2 and this explained 11.2 percent phenotypic variation. Another QTL was in between EM19-11–RZ682 on chromosomes #3, which explained 8 percent phenotypic variation. One QTL between EM14_9 – RZ682 with LOD score 3.09 was detected which explained 11.0 percent phenotypic variation on chromosome #6. Five QTLs were identified for grain L/B ratio, two each on chromosome #2 and 3, while one on chromosome #6. Two QTLS with LOD score 3.10 and 2.75 were detected between marker RG 437 to ME 10_18 and EM 18-13 to TGMSP2 and these explained 9.9 per cent and 10.5 per cent phenotypic variation respectively on chromosome #2. Two QTLs with LOD score 2.96 explaining 9.0 per cent and 9.9 per cent phenotypic variation were identified between RG 10 to EM 11-9 and EM 19-1 to RZ 474 on chromosome #3. One QTLs with LOD score 3.49 was detected between EM 149 to RZ 682 on chromosome #6 and this explained maximum of all the QTLs identified, 12.5 per cent phenotypic variation. Tan et al. (2000) identified one QTL for grain length on chromosome # 3 and one QTL on chromosome #5 for grain width using recombinant inbred (RI) population derived from indicia/indicia hybrid rice. Rendona and Mackill (1998) also found one QTL on chromosome #3 for grain length and one QTL on chromosome #4 for width in rice using F2 population derived from tropical Japonica /indicia cross. Dong et al. (2002) identified 3 QTLs controlling grain length on chromosome # 2, 3 and 10 using 67 recombinant inbred lines and their parents; Asominori and IR- 24. In this study for grain L/B ratio, 5 QTLs were identified on chromosome # 2, 3 and 6. From these results, it is apparent that some regions of chromosome 3 and 6 also associated with grain width, which to some degree could explain the fact that shape of rice grains basically coincided with that width of rice grain. Grain traits are known to be associated not only with grain size but also with several aspects of grain quality (Mckenzie and Rutger 1983).
QTL Analysis by Using Recombinant Inbred Line (RIL) Population
In RIL population, single marker analysis was used to estimate the association between marker and trait. For the single marker analysis, ‘t’ test was followed to find out the significant association between trait and marker. This set of data along with the data generated for another marker in the same population is used for QTL analysis. Among the various methods, single marker‘t’ test was used in the present study. The results of t-test are present in Table 4. The consensus map of SSR marker reported by McCouch et al. (2001) was used to develop a tentative map and is present in fig 4. The encircled marker exhibited significant association of these markers with the traits. Two means are calculated from the lines, which show male like, and female like microsatellite allele. The mean difference was subjected to the ‘t’ test analysis. The rice marker RM-110, RM-202, and RM-212 show significant association with grain length and RM-84 and RM-539 shows significant association with grain width and RM-163, RM-202, RM-247 and RM-80 shows significant association with L/B ratio. The SSR marker-based genetic linkage map developed by McCouch et al. (2001) was used to assign the location of marker used in this study.
Table 4: Results of “t” test indicating association of quantitative trait with markers
| Marker | f. value | f. value | f. value |
| Grain length | Grain Width | L/B ratio | |
| RM-84 | 1.815 | 2.048* | 0.269 |
| RM-163 | 1.155 | 1.020 | 2.137* |
| RM-110 | 2.03* | 0.987 | 0.180 |
| RM-202 | 3.196* | 0.965 | 2.302* |
| RM-212 | 2.124* | 1.950 | 0.691 |
| RM-247 | 1.643 | 1.349 | 2.054* |
| RM-539 | 0.282 | 2.569* | 1.979 |
| RM-80 | 0.140 | 0.241 | 2.137* |
| OSR-22 | 2.612* | 1.966 | 2.826* |
* – Significant at 5 per cent of significance
Table 5: QTLs analysis for Grain Width and L/B ratio
| Marker Interval For Grain Width | QTLs Effects | % Variance Explained | LOD Value | Chromosome Number |
| RG 437-ME 10-18 | -0.0544 | 11.2 | 3.57 | 2 |
| EM 18-13-TGMP2 | -0.0441 | 9.4 | 2.37 | 2 |
| RG 104-EM 11-9 | -0.0441 | 6.2 | 2.03 | 3 |
| EM 19-11-R2 682 | -0.0498 | 8.0 | 2.62 | 3 |
| EM 14-9 RZ 682 | 0.0559 | 11 | 3.09 | 6 |
| For Length / Width ratio | ||||
| RG 437-ME 10-18 | 0.1158 | 9.9 | 3.10 | 2 |
| EM 18-13-TGMSP2 | -0.2000 | 10.5 | 2.75 | 2 |
| RG 104-EM 11-9 | 0.1201 | 9.0 | 2.96 | 3 |
| EM 19-1-RZ 474 | 0.1280 | 9.9 | 2.96 | 3 |
| EM 149-RZ 682 | -0.1358 | 12.5 | 3.49 | 6 |
| For grain Length | ||||
| No QTLs detected | – | – | – | – |
Further research aimed at fine mapping and cloning these agriculturally important QTLs will accelerate the effort to improve the resolution and accuracy of marker-assisted plant improved as well as provide insight into the molecular mechanisms that govern critical aspects of crop performance.
Acknowledgments
Authors acknowledge to Department of Plant Molecular Biology and Biotechnology, Indira Gandhi Agricultural University, Raipur, CG, India for providing necessary facilities for conducting research.
References
- Halpern S. D., Ubel P. A., Caplan A. L. Solid-organ transplantation in HIV-infected patients. N. Engl. J. Med. 2002; 347(4):284-7.
- Agrama H. A. S and Moussa M. E. Mapping QTLs in breeding for drought tolerance in maize (Zea mays L.). Euphytica. 1996;9:89-97.
- Allard R.W. Principles of Plant Breeding, Wiley, New York. 1960.
- Botstein D., White R. L., Skolnick M., Davis R.W. Construction of a genetic linkage map in man using restriction fragment length polymorphism. Am. J. Human Genet. 1980;32:314-331.
- Cheema A. A., Agawam M. A., Tahir G. R., Aslam M. Heterosis and Combining ability studies in rice. Oryza. 1988; 2:218-224.
- Dong Y., Yunfe I. Z., Tsuzuki E., Terao H. Y., Dong Y. J., Zheng Y. E. Quantitative trait loci controlling steamed-rice shape in a recombinant inbred population. International Rice Research Notes. 2002;27(1):19-20.
- Dudley J. W. Molecular markers in plant improvement: Manipulation of genes affecting quantitative traits. Crop Sci. 1993;33:680-688.
- Garland S. H., Lewin L., Abedinia M., Henry R., Blakeney A. The use of microsatellite polymorphism for the identification of Australian breeding lines of rice (Oryza sativa L.). Euphytica. 1999;108:53-63.
- Grandillo S and Fulton T. M. Molecular Plant Biology (ed). Philip M., Gilmartin and Bowler C., Oxford University Press. 2002;1:274.
- Gungo E., Hebert Y., Charcosset A. Genetic analysis of root traits in maize. Agronomie. 1998;18:225-235.
- Haque M. M., Faridi M. N. I., Razzaque C. A., Wawaz M. A. Combining ability for yield and components character in rice. Indian J. Agric. Sci. 1981;51(10):711-714.
- He-Cixin., Zhu-Jun., Yan-Juqiang., Benmousssa M.,Wu P. QTL mapping for the developmental behavior of panicle dry weight in rice. Scientia-Agriculture Sinica. 2000;33(1):24-32.
- Juliano B. O., Villareal C. P. Grain quality evaluation of world rice. International Rice Research Institute, Manila, The Philippines. 1993.
- Juliano B. O., Perez C. M., Kaosa-Ard M. Grain quality characteristics of export rice in selected markets. Cereal Chem. 1990;67:192–197.
- Kiem P., Diers B. W., Olson T. C., Shoemaker R. C. RFLP mapping in Soybean: Association between marker loci and variation in quantitative traits. Genetics. 1990;126:735-742.
- Lander E. S., Green P., Abrahamson J., Barlow A., Daly M. J., Linear S. E., NewBurg L. Mapmaker an interactive computer package for constructing primary genetic linkage maps of experimental and natural populations. Genetics. 1987;1:174-181.
- Lebreton C., Lazic–Jancle V., Steed A., Pekle S., Quarie S. A. Identification of QTL for drought responses in maize and their use in testing causal relationships between traits. J. Exp. Bot. 1995;46:853-865.
- Lee M. DNA marker and plant breeding programs. Adv. Agron. 1995;46:853-865.
- Lynch M., Walsh B. Genetics and analysis of quantitative traits. Sunderland, Massachusetts, USA: Sinauer Associates. 1998.
- McCouch S. R., Temnykh S., Lukashova A., Coburn J., Declerck G., Cartinhour S., Harrington S., Thomson M., Sptiningsih E., Semon M., Moncada P., Giming L. I. () Microsatellite marker in rice: Abundance diversity and application in rice. Genetics. 2001;4:117-118.
- McCouch S. R., Chen X., Panaud O., Temnykh S., Xu Y., Cho Y. G., Huang N., Ishii T., Blair M. Microsatellite marker development, mapping and applications in rice genetics and breeding. Plant Mol. Biol. 1997;35:89-99.
- McKenzie K. S., Rutger J. N. Genetic analysis of amylose content, alkali spreading score and grain dimensions in rice. Crop Sci. 1983;23:306–311.
- Mckill D. J., Zhang Z., Redona E. D., Colowite P. M. Level of polymorphism and genetic mapping of AFLP markers in rice. Genome. 1996;39:969-977.
- Melchinger A. E., Utz H. F., Schon C. C. Quantitative trait locus (QTL) mapping using different testers and independent population samples in maize reveals the low power of QTL detection and large bias in estimates of QTL effects. Genetics. 1998;149:383-403.
- Olufowote J. O., Xu Y., Chen X., Par W. D., Beachel H. M., Daily R. H., Goto M., McCouch S. R. Comparative evaluation of within-cultivar variation of rice (Oryza sativa L.) using microsatellite and RFLP markers. Genome. 1997;40:370-378.
- Openshaw S., Frascaroll E. QTL detection and marker-assisted selection for complex traits in maize. Proceedings of the 52nd Annual Corn and Sorghum Research Conference, American Seed Trade Association, Washington DC, 1997;44-53.
- Prioul J. L., Quarrie S., Causse M., de Vienne D. Dissecting complex physiological function through the use of molecular quantitative genetics. J. Exp. Bot. 1996;48:1151-1163.
- Quarrie S. A. New molecular tools to improve the efficiency of breeding for increased drought resistance. Plant growth regulation. 1996;20:167-178.
- Ramadan M., Patwary A. K., Miah A. J. Combining ability in rice. Ind. J. Agric. Sci. 1981;51(8):543-546.
- Redona E. D and Mackill D. J. Quantitative trait loci analysis for rice panicle and grain characteristics. Theor. Appl. Genet. 1998;96:957-963.
- Ribaut J. M., Hoisington D. Marker-assisted selection: new tools and strategies. Trends in Plant Science. 1998;31:263-239.
- Sax K. The association of size differences with seed-coat pattern and pigmentation in Phaseolus vulgaris. Genetics. 1923;8:552-560.
- Sellamuthu R., Liu G. F., Ranganathan C. B., Serraj R. Genetic analysis and validation of quantitative trait loci associated with reproductive growth traits and grain yield under drought stress in a doubled haploid line population of rice (Oryza sativa L.). Field Crops Res. 2011;124:46-58,
- Singh R. P.,Singh R. R., Singh S. P., Singh R. V. Estimation of the genetic component of variation in rice. Oryza. 1980;17:24-27.
- Stuber C. W., Polacco M., Senior M. L. Synergy of empirical breeding, marker-assisted selection and genomics to increase crop yield potential. Crop Sci. 1999;39:1571-1583.
- Tan Y. F., Xing Y. Z., Li J., Yu S. B., Xu C. G., Zhang Q. Genetic bases of appearance quality of rice grains in shanyou 63 an elite rice hybrid. Theor. Appl . Genet. 2000;101:823-829.
- Tanksley S. D. Mapping Polygenes. Ann. Rev. Genet. 1993;27:205-233.
- Lander E. S., Botstein D. Mapping Mendelian factors underlying quantitative trait using RFLP linkage maps. Genetics. 1989;121:185-199.
- Taramino G., Tingey S. Simple sequence repeats for germplasm analysis and mapping in maize. Genome. 1996; 39:277-287.
- Temnykh S., Park W. D., Ayres N., Contrihour S., Hauck N., Liponich L., Cho Y. G., Ishii T., McCouch S. R. Mapping and genome organization of microsatellite sequence in rice (Oryza sativa L.). Theor. Appl. Genet. 2000;100:697-712.
- Tripathy J. N., Zhang J., Robin S., Nguyen T. T., Nguyen H. T. QTLs for cell membrane stability mapped in rice under drought stress. Theor. Appl. Genet. 2000;100;1197-1202.
- Tuberosa R., Parentonl S., Kim T. S., Sanguineti M. C., Phillps R. L. Mapping QTLs for ABA concentration in leaves of maize cross segregating for antithesis date. Maize Genet. Coop. Newsletter. 1998;72:72-73.
- Unnevehr L. J., Duff B., Juliano B.O. Consumer demand for rice grain quality. International Rice Research Institute, Manila, The Philippines and International Development Research Center, Ottawa, Canada. 1992.
- Yang G. P., Maroof M. A. S., Xu C. G., Zhang Q., Biyashev R. M. Comparative analysis of microsatellite DNA polymorphism in landraces and cultivars of rice. Mol. Gen. Genet. 1994;245:187-194.
- Young N. D. A cautiously optimistic vision for marker-assisted breeding. Mol. Breeding. 1999;5:505-510.

This work is licensed under a Creative Commons Attribution 4.0 International License.


