How to Cite | Publication History | PlumX Article Matrix
A. Abu-Rizaiza1, M.W. Kadi2 and M.S. El-Shahawi 2
1Department of Environmental Sciences, Faculty of Meteorology, Environment and Arid Land Agriculture, King Abdulaziz University, Jeddah, Saudi Arabia.
2Department of Chemistry, Faculty of Science, King Abdulaziz University, P.O.Box 80203, Jeddah 21589, Saudi Arabia.
Corresponding Author E-mail: malsaeed@kau.edu.sa
DOI : http://dx.doi.org/10.13005/bbra/2548
ABSTRACT: Activated carbons (AC) prepared from volatile fly ash (FA) of heavy fuel oil via gasification with combined steam - CO2 was characterized and used as a low- cost adsorbent for removal of chlorophenols (CPs) e.g. 2-chlorophenol (2-CP), 4-chlorophenol (4-CP), and 2,4,6- tetra chlorphenol (TCP) in water. At pH< 2.0, maximum CPs uptake was achieved and the average half-life time (t1/2) of the equilibrium adsorption of CPs was in the range 0.80 ± 0.01- 1.1 ± 0.04 h. Data suggested use of AC in packed column for separation and determination of various concentrations (0.5-100 µgL-1) of CPs in water (0.5-1.0 L). Complete extraction and recovery (97.4 + 2.9 %, n=5) of CPs were achieved at 2 mL min-1 flow rate. Analysis of CPs spiked onto tap- and seawater were also analyzed by AC packed column and the results were compared with the standard HPLC method at 95% confidence (P-0.05, n=5). The experimental student t test (texp 1.81-1.93) and F (Fexp 1.21-5.76) values were lower than the tabulated t (tcrit. = 2.78) and F (6.38), respectively. AC packed column provides remarkable selectivity, reproducibility, and cost-effectiveness towards removal and/ or determination of CPs. AC adsorbent may serve positively in point-of-care use.
KEYWORDS: Activated Carbon; Adsorption; Chlorophenols Removal; Fly Ash;HPLC; Water
Download this article as:| Copy the following to cite this article: Abu-Rizaiza A, Kadi M. W, El-Shahawi M. S. Activated Carbon from Fly Ash of Heavy Fuel Oil: Characterization and its Utilization for Removal and Determination of Chlorophenonls in Water. Biosci Biotech Res Asia 2017;14(3). |
| Copy the following to cite this URL: Abu-Rizaiza A, Kadi M. W, El-Shahawi M. S. Activated Carbon from Fly Ash of Heavy Fuel Oil: Characterization and its Utilization for Removal and Determination of Chlorophenonls in Water. Biosci Biotech Res Asia 2017;14(3). Available from: https://www.biotech-asia.org/?p=27863 |
Introduction
In the last couple of decades, FA generated from heavy fuel oil has received less attention compared to coal (Pires and Querol, 2004; Alonso-Hernández et al., 2011; Al-Degs et al., 2014). Currently, Saudi Arabia power plants are powered by heavy fuel oil, diesel, and natural gas (Salehin et al., 2015; Gómez et al., 2007). The composition of FA of coal origin is characterized by high Si and Al content which make it suitable ingredient for Portland cement and starting material for geopolymers (van Jaarsveld et al., 2002). A limited number of articles have been reported on surface characterization residual FA of heavy fuel oil (Komnitsas and Zaharaki, 2007; Al-Degs et al., 2014; Caoa et al., 2014). Few reports on treatment of FA have been published (Bailey et al., 1999; Jaarsveld et al., 2002; Nazari et al., 2011; Izquierdo and Querol, 2012; Tao et al., 2014; Alhamed et al., 2015). Both treated and untreated FA are considered solid wastes that create serious pollution problems in power plants, its surroundings and in its landfill areas (Ghouti et al., 2011; Alhamed et al., 2015).
In recent years, many articles have been studied the utilization of FA with two fold approaches: i) reduction of solid waste generation (Anadinin et al., 2008 ; Al-Degs et al., 2014; Alhamed et al., 2015) and ii) use of AC prepared from FA as a low cost solid phase extractor (SPE) for removal of phenols, heavy metal ions, and other pollutants in industrial wastewater samples and liquids (Kurniawan et al., 2003; Izquierdo and Rubio, 2008; Petrova et al, 2010; Barakat,2011; Vigan and Neag, 2012; Ismail et al., 2013; Ihsanullah et al., 2015). AC is one of the most widely used solid adsorbent and it has many uses in filtration, purification, super capacitors, hydrogen storage and in catalysis because of its high surface area, well-developed internal pore structure and surface chemical functional groups at the outer and inner surfaces (Bouzerara et al., 2006; Liu et al., 20013; Zhu et al., 2015). Utilization of FA has become a novel technology in the last few decades (Izquierdo and Rubio,2008; Al-Ghouti, et al.2011, Alhamed,et al., 2015; Salehin, et al., 2016).
Phenol and CPs are introduced into aquatic environment from various industries that include petrochemical industry, dyes, plastics, pesticides, drugs antioxidants, adhesives and epoxy resins and paper (Rodr´ıguez et al, 2000). US- Environmental Protection Agency (EPA) has prioritized phenols as potential toxin at trace and ultra-trace levels in water and fish due to their toxicity and other unpleasant organoleptic properties (Martínez et al., 1996; Pizarro et al, 2007). The permissible range set by The European Union (EU) set the permissible range for total phenols of in drinking water as 0.5 μgL-1 and the level of individual phenolic compound should be under 0.1 μg L-1 (Pizarro et al.,2007; Limam et al.,2010). In seawater, 2, 4-Dichlorophenol (DCP) and penta- chlorophenol (PCP) have relatively high levels up to 1500 ng L-1 (‘EPA Method 804, 1995; Basheer and Lee, 2004). In surface water, median levels of DCP, TCP and polychlorinated phenol (PCP) are 5.0, 2.0, and 50 ng L-1, respectively. Such technology can provide extraction, sampling, concentration and sample introduction processes as a whole automatically at one time.
Recently, utilization of AC prepared from FA as low cost SPE as a novel technology for removal, extraction of many pollutants have received considerable interest in the last few years (Izquierdo and Rubio,2008; Al-Ghouti, et al.2011; Alhamed, et al., 2015). AC is one of the widely used industrial solid adsorbents and carboneous materials which have developed internal pore structure (Gomes, et al., 2010). It has many important applications e.g. filtration and purification, super capacitors, drug delivery, hydrogen storage, catalysts, etc (Gokce and Aktas, 2014) . These applications are related with the adsorption behavior of AC. Thus, in this context the present study reports: i) Characterization of heavy fuel oil FA generated during the heavy fuel burning process of thermal power stations in Saudi Arabia; ii) Surface characterization of AC produced from FA by gasification with the combined gas mixture of CO2 and steam.; iii) adopting, designing and integrating the analytical utility of AC derived from FA as a SPE for removal of CPs from aquatic environment and finally; iv) developing of low cost AC packed column for chromatographic separation and/ or determination of CPs in water. The study will also helps in developing cost-effectiveness SPEs for monitoring and hampering the effects of phenols on local inhabitants.
Materials and Methods
Sampling
Rabigh is one of the smallest towns in Saudi Arabia and has one of the lowest populations as reported by Saudi government. It lies at latitude 23° N and longitudes 400 30’E along the Red Sea coast in the west central part of the Arabian Shield, Saudi Arabia. Residual FA samples of heavy fuel oil (Vacuum gas oil, Bunker “C”) generated from Rabigh water desalination power station were randomly collected from three locations around the station. The samples were then air dried for 21 days and sorted to remove unwanted materials. FA samples were washed with HCl solution (1.0 molL-1) for 16-17 h at room temperature where mixed with HCl (37%v/v) solution at FA waste/HCl weight ratio of 1: 20 (m/v) in a polytetrafluoroethylene beaker . The mixture solutions were filtered and washed several times with deionized water just to remove the water- soluble impurities and the adhered particles on the surface. The samples were dried in oven at 105 0C for 24 h and kept in the desiccators prior to activation. Three replicate samples were collected from the same site and analyzed separately.
Preparation of AC from FA residue
Pre treated FA samples (»3-4 g) were then dipped into H2O2 (30%v/v) solution for 24 h to oxidize volatile organic impurities and subsequently washed with water. In an oven, the FA samples were then heated at 100°C for 60 min to remove the moisture content. Heat treatment of the samples were carried out by the tube furnace connected to an electric heating boiler for passing combined CO2 (grade 2.5-B) -steam at 4 psi. The absolute pressure inside the tube was always kept below 0.12 MPa (Mega Pascal) and the heating rate of the furnace was maintained at 5°C min-1 and 6 psi, respectively. The absolute pressure inside the tube was always kept below 0.12 MPa (Mega Pascal). Samples were further heated between 850-950°C at a heating rate of 15°C/min for 3 h at 120 mLmin-1 flow rate to a final carbonization process and activation at 950°C. AC samples were left to cool down, washed with hot distilled water until the pH is neutral and finally dried in the oven at 105°C for 24 h . The calculated weight loss of FA samples during activation was in the range 17.57 % m/m (Table 1).
Table 1: Activation of Rabigh fly ash samples*
| Sample | Activation status | Weight loss during | Conditions |
| activation (%) | |||
| C1 | Not activated | —- | —- |
| C2 | Activated | 25.39 | Steam/850ºC / 1 hr |
| C3 | Activated | 64.6 | Steam/950ºC / 2 hr |
| C4 | Activated | 16.67 | CO2/950ºC / 2 hr |
| C5 | Activated | 17.57 | (CO2-Steam )/950ºC / 2 hr |
| C6 | Activated | 16.15 | (Steam + CO2)/850ºC / 2 hr |
Reagents and Materials
Analytical reagent grade chemicals were used. Glassware’s were washed with conc.
HNO3 and deionized water. Phenol, 2-chlorophenol (2-CP), 4-chlorophenol (4-CP), 2,4,6-trichlorophenol (TCP) were purchased from BDH (Poole, England). Stock standard solutions (10-1000 μg mL-1) of each phenolic compound were prepared individually at 1.0 mgL-1 in water in the presence of few drops of ethanol and stored at 4°C in dark. Working solutions (0.1-200 µg mL-1) were prepared by suitable dilution weekly with water from the stock standard solution and stored at 4°C in in amber glass bottles. Low density polyethylene (LDPE) bottles were carefully cleaned with hot detergent, soaked in 50 % HCl: HNO3 (2.0 mol L-1), subsequently washed with dilute HCl (0.5 mol L-1) and finally rinsed with deionized water. Britton-Rrobinson (B-R) buffer (pH 2.2-10) solutions were prepared as reported (Vogel, 1966). A total of six raw FA samples were randomly collected from Rabigh (C1, C3, C5, C7, C9, C11) power plants. Vacuum gas oil (Bunker “C”) on burning emits enormous amounts of obnoxious and toxic pollutants to the environment along with large amount of high C (87-92%) (36-38 tons /day) (Al-Degs et al, 2014; Alhamed et al., 2015).
Instrumentation
Textural properties (surface & pore size) of the FA samples before and after activation were measured using NOVA 2200e instrument (Quntachrome) at liquid nitrogen temperature. Heat treatments were carried out by a GSL-1800S60, MTI Inc., USA, Richmond, California tube furnace connected to an electric heating boiler was used for the heat treatment of the samples. A rotary van vacuum pump (Pfeiffer vacuum) was used to achieve a final pressure < 6×10⁻³ mbar and an exhaust pressure of 250-1500 mbar. Adsorption/desorption isotherms were measured in P/P° range 0.005 to 0.99. Adsorption measurements of N2 gas (AHG, 99.99%) as an adsorbate was measured. A particle size analyzer (Fritsch, Analysette 22 MicroTec Plus) installed with Mass Control software was used for measuring of particle size distribution of FA. A Perkin Elmer inductively coupled plasma–optical emission spectrometer (ICP- OES, Optima 4100 DC (Shelton, CT, USA) was used for analysis of V, Fe and Ni in FA samples. A Perkin Elmer spectrophotometer and high performance liquid chromatography (Agilant technologies, C18, 4.6× 150 mm) and UV detector were used for recording the absorbance and HPLC analysis of phenol, 2-chlorophenol (2-CP), 4-chlorophenol (4-CP) and 2,4,6 trichlorophenol (TCP). In HPLC, methanol-H2O was used as a mobile phase for analysis of phenols at 1.0 mL/min flow rate, 5.0 µl injector volumes, and 3.0 min run time at 270 nm. An Orion model 720 pH Meter was used for pH studies and glass columns (18cm x 15mm id) was utilized for flow experiments. A digital micropipette (Volac) was used for preparation of the solutions. Ultra pure water from Milli-Q Plus system (Millipore, Bedford, MA, USA) was utilized throughout the work.
Recommended Experimental Procedures
Batch Experiments
Batch studies were carried out for the adsorption of phenols onto AC as follows:
In conical flasks (250 mL), accurate weights (0.2 ± 0.001g) of AC prepared by activation of FA by gasification using the combined system steam- CO2 were equilibrated with aqueous solutions (100.0 mL, 10µg mL-1). The solution pH was adjusted to the required pH (2≤ pH ≤10) and shaken for 8.0 h at 25±1°C. After shaking the samples were filtered and the filtrates were subjected to the absorbance measurements and the amounts were determined from absorbance at λmax vs. blank. The amount of CP adsorbed onto the AC adsorbent was calculated by difference in absorbance before and after (Ab- Af). Following these procedures, the influence of shaking time and analyte concentration (10-50 µg mL-1) on phenols uptake by combined steam- CO2 activated AC after leaching were also studied. The adsorption percentage (% E), the amount of phenol retained at equilibrium (qe), and the distribution ratio (D) of phenol uptake by AC adsorbent were calculated (El-Shahawi et al, 2011).
Chromatographic Separation of CPs by AC-packed Column
HPLC Analysis of CPs Spiked onto in Deionized Water
The tested phenols were analyzed by the standard HPLC method (Limam,et al., 2010) as follows: Standard solutions (5-10 µg mL-1) of phenol, 2-CP, 4-CP and TCP were prepared in deionized water. Separation of phenols individually and in their standard mixtures was carried out in X- Bridge C18 (BEH 1.7 μm, 100 Í3 mm), (Waters, Acoquity UPC2) using the mobile phase 95 % CO2: 5 % methanol (at 1.0 mL min−1), the injector volume was 5.0 μL. The system was preconditioned by passing the mobile phase through HPLC system at 1.0 mL min−1 flow rate for 3.0 min. Photodiode array detector at the optimum wavelength of each phenolic compound was used for data acquisition.
Chromatographic Separation of CPs in Water by AC Packed Column
Retention and Recovery of 2-CP, 4-CP and TCP Individually and in Their Mixtures
A 0.5 L of deionized water spiked with various concentrations (0.1-10.0 µg mL-1) of phenol, 2-CP, 4-CP and TCP at pH ≤ 2 was percolated individually through the AC packed column at 3-5.0 mL min-1 flow rate versus reagent blank. Analysis of the effluent by the method of Limam,et al., 2010 revealed complete adsorption of the tested phenols on the AC packed column. The retained phenol, 2-CP, 4-CP and TCP species were recovered with NaOH (10 mL, 0.2mol L-1). Complete recovery of the phenols was achieved as noted from the absorbance and HPLC measurement (Limam,et al., 2010) after adjustment the pH of the eluate to pH ≤ 2versus reagent blank. On the other hand, a various mixtures (0.5-1 L) of 2-CP and TCP (1.0-10 µg mL-1) were percolated through the AC (0.5±0.02 g) packed column at pH ≤ 2 at 2.0 mL min-1 flow rate vs. blank. Adsorbed CPs species were then recovered with NaOH (10 mL, 0.2 mol L-1) at 2.0 mL min-1 flow rate and analyzed by HPLC (Limam,et al., 2010) versus reagent blank
Analytical Applications
Tap and Red seawater samples were collected from the Chemistry laboratories, King AbdulAziz University and coastal area of north Jeddah city, Saudi Arabia, respectively. The samples were filtered through 0.45 μm cellulose membrane filter prior to analysis. A 1000 mL of tap water spiked with tested 2-CP and TCP individually at concentration(0.1-10 mg mL-1) was percolated through AC packed column. Complete retention and recovery was achieved as described. Data were expressed as mean± standard deviation (n=5). Precision was tested by subjecting five sub samples to the sequential procedures
Results and Discussion
Recently, great attention has been focused on: i) The production of AC from different natural and solid waste materials to be used for removal of inorganic and organic pollutants from contaminated wastewater (Visa et al., 2014; Petrova et al., 2010) and ii) Modifying water treatment technologies for removal of phenol and CPs. Thus, this study is focused on preparation of AC adsorbent from fuel oil FA for utilization as low cost adsorbent for removal of trace phenol and CPs in wastewater.
Characterization of FA and AC
Applications of AC are related to its adsorption characteristics e.g. high surface area, well-developed internal pore structure and surface chemical functional groups located at the outer and inner surfaces (Gokce and Aktas, 2014). Chemical analysis of FA samples revealed considerable content of V, Fe and Ni. The most next abundant elements are Na, S, K, Si, Al in addition to other trace elements. V, Fe and Ni content in the FA samples were in the range 3625.1±21.8-5601.3± 27.6; 4057.0±32.7-9913.9±23.2 and 751.2±13.7- 2632.9±41.2 μg g-1, respectively. The average content of V and Fe was in agreement with the data reported except for Ni (Norris, et al., 2010). Ni species able to form stable complexes and/or organo-nickel compounds with the oxygenated and organo-carbon species in FA resulting in a partial or incomplete digestion of the FA. Average C, H , N and total CHN of FA samples were in the range 87.85± 3.78- 87.93± 5.3; 0.04± 0.003- 0.15± 0.03; 1.49 ± 0.27 -1.51± 0.27 and 89.46± 3.6 -89.51± 2.14, respectively. The weight loss of FA samples was 91.45 close with the FA of other heavy fuel oils (Caoa et al., 2014; Alhamed et al., 2015).
Particle size distribution (PSD) of FA samples is measured and representative data of C1 (without activation) are shown in Fig. 1. Variation of the particle size with milling time and the distribution curve shift to fine size region with increase in the milling time. The curve shows that the effect of longer milling times on the particle size is significant, most likely due the hardness of the particles. Three major sizes were found in the range 1.8-16.4, 15.1-21.6 and 25.3 -30.3 µm with frequencies 10, 50 and 90, respectively. PSD is slightly trimodal and broader than other samples.
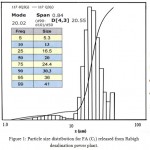 |
Figure 1: Particle size distribution for FA (C1) released from Rabigh desalination power plant.
|
Nitrogen adsorption-desorption isotherms of the samples were recorded. Representative data for combined CO2-steam activated carbon (C5) are shown in Fig. 2. Isotherms of samples revealed combination of micro porous and mesoporous structures. The surface area of non activated (C1) and activated FA residues (C2-C6) are summarized in Table 2. The burn of at 850 and 950°C lies in the range 16.15-25.39 and 16.67-64.6%. The surface area of samples C5 activated by the combined gasification of CO2-steam system was 775.919 m2/g, while for non activated (C1) and activated carbons (C2-C4 & C6) , the surface area was in the range 71.554 – 423.094 m2/g, respectively.
The surface area and pore volume of non activated (C1) and activated FA residues (C2-C6) were critically measured.
Table 2: Surface area and pore volume of Rabegh FA samples*
| Sample | Activation status | Experimental conditions | Burn-off level | surface area | Pore volume (cc/g) in (1.65-1.85 nm) pore width |
| (%) | (m2/g) | ||||
| C1 | NA | —- | —- | 110.887 | 0.043 |
| C2 | Activated | SA at 850 0C (1 hr.) | 25.39 | 256.447 | 0.091 |
| C3 | Activated | SA at 950 0C (2 hrs.) | 64.6 | 275.076 | 0.325 |
| C4 | Activated | CA at 950 0C (2 hrs.) | 16.67 | 269.013 | 0.07 |
| C5 | Activated | SCA at 950 0C (2 hrs.) | 17.57 | 775.919 | 0.138 |
| C6 | Activated | SCA at 850 0C (2 hrs.) | 16.15 | 423.094 | 0.078 |
*NA: Not Activated; SA: Steam Activated; CA: CO2 Activated; SCA: Combined CO2-steam activated.
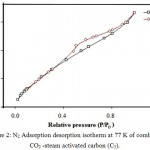 |
Figure 2: N2 Adsorption desorption isotherm at 77 K of combined CO2 -steam activated carbon (C5).
|
The results of pore volume distribution of the investigated non activated (C1) and activated (C2-C6) samples are depicted in Table 2. Excellent value of pore volume of C5 (0.138cc/g) was achieved compared to other samples (C1 and C2-C4 and C6) samples (Table 2). At 850°C, the pore volume decreased or did not develop well at different time intervals. Thus, activation by CO2-steam system is the most successful approach for FA activation at 950°C for 2 h. Thus, C5 AC was selected in the next work for separation of CPs from water samples.
The XRD patterns of traces of FA samples were recorded at room temperature. Representative XRD for C2 is shown in Fig. 3. Similar broad peaks were noticed in all samples showing highly disordered and amorphous nature of raw and FA samples. In all samples, calcium containing minerals e.g. CaSO4, KCaCl3 etc were found whereas anorthite (CaAl2Si2O8) was the only aluminosilicate found with an FOM close to 20 in a agreement with the data reported earlier in the precipitator (Liu et al., 2009.) Presence of sharp structural peaks in the XRD spectra of residual oil FA (C1 & C2) suggested that they are polycrystalline in nature
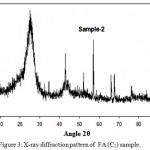 |
Figure 3: X-ray diffraction pattern of FA (C1) sample.
|
SEM images were recorded for selected FA samples (C1-C4) at different resolution (10, 20 and 100μm) to assign the surface microstructure. SEM images for C1 sample are shown in Fig. 4. The main composition of FA is a porous spheroid of unburned carbon with diameters within a range from 10.0 to 120 mm larger than that of black carbon and contains small pores few mm in sizes. The images showed many of iron spheres composed of Fe2O3 mixed with amorphous alumino-silicate. Calcium associated with S and/ or P in distinct particles was also noticed not with amorphous alumino-silicate. Small pores may have formed during the combustion process of heavy oil FA. The particles are mainly spherical, porous spheroid of unburned carbon, hollow and granular in size (Fig. 4).
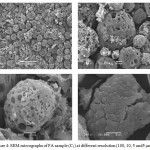 |
Figure 4: SEM micrographs of FA sample (C1) at different resolution (100, 10, 5 and5 µm).
|
Batch Adsorption Characteristics of Phenol and CPs
Considerable progress has been made on the use of FA and AC generated from heavy oil and coal FA as inexpensive and effective solid adsorbent for the removal of water pollutants (Izquierdo and Rubio, 2008; Alonso-Hernández et al., 2011; Al-Degs, et al.,2014; Salehin, et al.,2015; Alhamed et al., 2015).). AC adsorbent concentrates inorganic and organic substances from different aqueous media by adsorption mechanism rather than phase distribution (Al-Ghouti et al., 2011; Salehin, Alhamed et al., 2015). Preliminary study on the extraction of phenol and selected CPs from aqueous solution at pH ≤ 2 by combined CO2-steam AC (C5) revealed considerable adsorption of the analyte. Thus, in batch experiments, the adsorption profile of 2-CP and 4-CP (10 mg mL-1) individually at a wide range of pH (pH 1.0-9) onto AC (0.1±0.001g) was performed after shaking at room temperature. CPs in the test aqueous solution before (Ab) and after (Aa) extraction was determined via the difference in the absorbance (Ab– Aa) at λmax for each individual phenol or CP. Results for 2-CP is shown in Fig. 5. The uptake of phenols reached maximum at pH ≤ 2 and decreased markedly at higher pH (Fig. 5). The adsorption was rapid and reached equilibrium in a short time, followed by a plateau. At pH ≤ 2.0, the high adsorption of phenol and CPs is attributed to: i) Multi mode mechanism involving adsorption and/ or solvent extraction mechanism; ii). Phenol and/or CPs species at pH ≤ 2.0 present in neutral form ( not dissociated) and finally iii). Formation of intermolecular H-bonding between the available oxy- species on the AC adsorbent and phenol or CP in the bulk aqueous solution. In aqueous solution of pH >2, the uptake of phenolic species onto AC adsorbent decreased markedly (Fig. 5) because of deprotonation of phenols at higher pH. Phenol and CPs uptake followed the order: TCP > 2-CP > 4-CP > phenol in agreement with their pKa 6.35, 8.55, 9.38 and 9.90, respectively. Thus, in the next experiments, the solution pH was adjusted at pH ≤ 2.0.
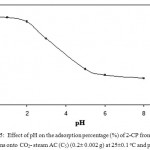 |
Figure 5: Effect of pH on the adsorption percentage (%) of 2-CP from the aqueous solutions onto CO2– steam AC (C5) (0.2± 0.002 g) at 25±0.1°C and pH ≤ 2.
|
Kinetic of Phenol and CPs Adsorption by AC
The effect of shaking time on phenols uptake by AC adsorbent was studied at various time intervals. The adsorption of the phenols attained equilibrium within a short shaking time followed by a plateau. A representative adsorption rate of 2-CP from the aqueous solution at pH ≤ 2 is shown in Fig. 6. The half-life time (t1/2) of equilibrium adsorption as calculated from Fig. 6 was 0.80 ± 0.01, 1.05 ± 0.01, 1.0 ± 0.01 and 1.2 ± 0.04 h for TCP, 2-CP, 4-CP and phenol, respectively.
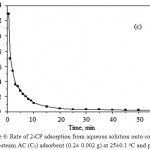 |
Figure 6: Rate of 2-CP adsorption from aqueous solution onto combined CO2-steam AC (C5) adsorbent (0.2± 0.002 g) at 25±0.1°C and pH ≤ 2.
|
The results of CPs uptake by AC were further subjected toWeber &Morris, 1963 model:
qt =Rd (t)½ (1)
where, Rd = rate constant of intraparticle transport (mmol g-1 min–½) and qt is the adsorbed phenol concentration (mol.g-1) at time t. Representative results for 2-CP adsorption are demonstrated in Fig. 7. The plot of qt vs. time was linear (R2=0.975) in the initial stage up to 12.25 min and deviate on time passage (Fig. 7). The plot does not pass through the origin, the kinetics of 2-CP adsorption depends on film and intra particle diffusion and the more rapid one will control the overall rate of 2-CP transport (El-Shahawi et al, 2011). The diffusion of 2-CP was high at the early stage and decreased on time passage. Thus, the rate of the retention step is film diffusion at the early stage of extraction. In the second stage, diffusion remains fairly constant where the pores volume of the AC adsorbent is exhausted. Thus, it can be concluded that, 2-CP uptake onto the adsorbent involves the following steps: i- bulk transport of phenol in solution, ii- film transfer of analyte within the pore volume and/or along the pore wall surface by diffusion to the active adsorption sites of AC and finally iii- formation of adsorbed phenols species on the AC. Compared to other microsized adsorbents (Vigan, Neag, 2012), the proposed AC offers a short diffusion route and high surface area which results in rapid extraction dynamics and high extraction capacity.
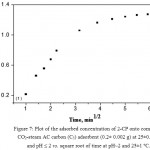 |
Figure 7: Plot of the adsorbed concentration of 2-CP onto combined CO2-steam AC carbon (C5) adsorbent (0.2± 0.002 g) at 25±0.1 °C and pH ≤ 2 vs. square root of time at pH~2 and 25±1ºC.
|
Chromatographic Separation of Phenol and CPs by the Proposed AC Packed Column
The kinetics of CPs and phenol uptake from water by AC adsorbent suggested its use in packed column for their separation from deionized water. Thus, deionized water (0.5L) containing 2-CP, 4-CP, TCP and phenol at various concentrations (1.0-10.0µg mL-1) were individually percolated through AC packed column at pH ≤ 2.0 vs. reagent blank. Complete retention of phenols was achieved as indicated from the absorbance and/or HPLC (Limam,et al., 2010, Pizarro et al, 2007) measurement in the effluent solution. The retained species were then recovered with NaOH (10 mL, 0.2mol L-1) at 2.0 mL min-1 flow rate. The absorbance and HPLC (Limam,et al., 2010) data of the eluate after adjusting the solution to pH≤ 2.0, revealed complete recovery of 2-CP (94.0 ± 4.9 -95.4 ±5.3%) and 4-CP (95.0± 5.3-100± 1.0% (Table 3). These results suggested application of the AC packed column for developing HPLC method for analysis of trace concentrations (<0.5 µgL-1) of phenols in environmental water samples.
Table 3: Extraction and recovery of 2-CP and 4-CP from deionized water by AC packed column at 5 mL min-1 flow rate
| Compound | Amount added, | Found, μg mL-1 | Recovery*,% |
| μg mL-1 | |||
| 2- CP | 1 | 0.953±0.07 | 95.3 ± 4.9 |
| 5 | 4.77± 0.23 | 95.00 ± 4.8 | |
| 10 | 9.5±0.5 | 95.4 ± 5.3 | |
| TCP | 1 | 0.95± 0.04 | 95.0± 5.3 |
| 5 | 4.96± 0.04 | 99.2± 0.81 | |
| 10 | 10.0± 0.0 | 100± 0.0 |
* Average (n=3) ± relative standard deviation at 5 mL min-1 flow rate
HPLC chromatogram of the standard solutions (10.0µg mL-1) for phenol, 2-CP, 4-CP and TCP were recorded individually and their retention times were found equal 0.946, 0.994, 1.222 and 1.31 min, respectively. HPLC chromatogram of standard solution mixture of phenol, 2-CP, 4-CP, TCP at total concentration ≤10µg mL-1 in deionized water was recorded at pH 2-3. Representative HPLC chromatogram of the four phenols is shown in Fig. 8. Phenol, 2-CP, 4-CP and TCP were easily identified from their retention times. The slight change in the retention times mixtures as compared to each individual may be attributed to the electrostatic interaction of their phenolic OH group and formation of inter molecular H- bonding between phenols.
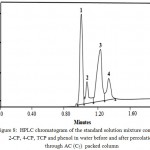 |
Figure 8: HPLC chromatogram of the standard solution mixture containing 2-CP, 4-CP, TCP and phenol in water before and after percolation through AC (C5) packed column
|
HPLC chromatograms of the test solution containing 2-CP, 4-CP, TCP and phenol in water before and after percolation through AC packed column were also recorded. Good recovery percentage (95.3-107%) of 2-CP, phenol and TCP were achieved whereas low recovery of phenol (85.1±3.9) and 4-CP (76.8 ±2.9%) was noticed. A possible explanation for the poor recovery of phenol and 4-CP in comparison to 2-CP and TCP may be due to the incorrect calculation of their HPLC peak areas and/or high adsorption affinity towards AC resulting in incomplete recovery of their species. The low lipophilicity of phenol and 4-CP decreases their penetration through the AC packed column. Thus, the HPLC chromatogram of phenol and 4-CP very sensitive to any slight change in the experimental conditions. The results suggested use of AC packed column for HPLC separation of trace concentrations (<0.5 μgL-1) of 2-CP and TCP in environmental water samples.
Figures of Merits of the Proposed AC Packed Column
Solution mixtures containing 2-CP and TCP at various concentrations (01-10μg/L) in deionized water were passed through the AC packed column at pH<2. Complete extraction of 2-CP and TCP was achieved as indicated from the HPLC chromatograms before and after percolation through AC packed column. The adsorbed species were then recovered with NaOH (10 mL, 0.2 mol/L) at 2.0 mL min-1 flow rate. The plots of peak area (A) of the HPLC chromatograms vs. concentrations (0.1-10µg/L) of 2-CP and/or TCP were linear as given by the following regression equations:
A= 5.1 ×10³C (ng L-1) + 12.96, (r2=0.9995, n=10) (2)
A= 4.2 ×10³C (ng L-1) + 11.15, (r2=0.9985, n=10) (3)
respectively. The value of C is the CP concentration. Representative HPLC chromatogram of the recovered 2-CP and TCP (2 µg mL-1) in water with NaOH (1.0 mol/L) at 1.0 mL min-1 flow rate at 25 ±1°C is shown in Fig. 9.
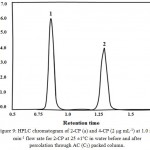 |
Figure 9: HPLC chromatogram of 2-CP (a) and 4-CP (2 µg mL-1) at 1.0 mL min-1 flow rate for 2-CP at 25 ±1°C in water before and after percolation through AC (C5) packed column.
|
The values of LOD (LOD= 3Sy/x/b) and quantification ( LOQ = 10Sy/x/b ) (Miller and Miller, 2010) for 2-CP were found equal 0.7 and 2.7 µg L-1 for 2-CP and 0.8 and 2.9 µg L-1 for TCP, respectively (Vsample= 0.5L) where, Sy/x is the standard deviation of y– residual and b is the slope of the linear plot. The enrichment factor (Fc= Vs,b/Ve,v) i.e. the ratio between the volume of 2-CP before preconcen -tration (Vs,b= 1.0 L) and the volume of eluent after recovery (Ve,v=0.01L) was in the range 100-110, where’s the sensitivity factor (the ratio of the slopes with and without preconcentration) was 33.3-35.2. The RSD for extraction and subsequent determination of standard 2-CP solution (5 μg L-1) was ±2.3 % (n= 5). The LOD and LOQ of the developed AC packed column were satisfactorily compared with the standard HPLC methods ((Pizarro et al, 2007; Limam,et al., 2010) and many spectrophotometric and electroanalytical methods confirming the utility of the AC packed column. The value of LOD of the proposed AC packed column is lower than the allowable limit for CPs set by WHO in water. The proposed AC packed column good enrichment and selectivity, low LOD and easy sample preparation for analysis of CPs in water.
Method Validation
The analytical utility of AC packed column was validated by preconcentration and determination of 2-CP and TCP from water at trace concentrations (0.1 – 1.0 µg mL-1). Satisfactorily extraction and recovery of 1.0 μg L-1 (93.0 ± 5 to 101.8 ± 1.6) of both 2-CP and TCP in their mixture in water (1.0 L) was achieved. The results were compared with the standard HPLC methods (Limam,et al., 2010; Pizarro et al, 2007) for analysis of 2-CP and TCP in water. CPs. The results were further subjected to student t test at 95% confidence (n=5). No significant differences between the experimental t (texp =0.0-2.17) and tabulated (ttab =2.78) values (Miller & Miller, 2010). Thus, the proposed AC packed column provides good precision for collection and subsequent analysis of CPs in water. AC packed column could be reused for more than three times without decrease in column performance, Hence, the utility of our low SPE may serve positively in point-of-care applications.
Analytical Applications
The utility of AC packed column was assessed by performing the recovery tests of spiked 2-CP and/ or TCP (1.0 –10 μg L-1) individually and/or in mixture onto tap- and seawater sample (0.5-1.0 L). The test solutions were first spiked with the tested 2-CP (1.0 –10 μg L-1) ; filtered with cellulose membrane filter (0.25 μm) and percolated through AC packed columns at pH< 2.0. The retained CPs onto the AC packed column were recovered by NaOH and finally analyzed by the proposed and standard HPLC method (Limam,et al., 2010).The results are summarized in Table 4. At 95 % confidence (P=0.05, n=5), the experimental student –t (texp 1.81-1.93) and F (Fexp 1.21-5.76) tests were lower than the tabulated t (tcrit. = 2.78) and F(6.38) values showing no significant differences between the added and found CPs (Miller, Miller, J.C. (2010).
Table 4: Analytical results of 2-CP and TCP spiked into tap and sea water samples by the proposed iron (Ш) treated PUFs packed column
| Compound | Water sample | Taken, μg L-1 | Found, μg L-1 | Recovery*, % |
| 2- CP | Tap water | 1 | 0.945 ±0.06 | 94.5±5.8 |
| 5 | 4.83 ±0.17 | 96.6 ±3.5 | ||
| 10 | 9.58±0.42 | 95.8±4.4 | ||
| Sea water | 1 | 0.959±0.041 | 95.9±4.3 | |
| 5 | 4.75±0.25 | 94.9±5.3 | ||
| 10 | 9.5±0.5 | 95.3±5.3 | ||
| TCP | Tap water | 1 | 0.93±0.07 | 93±4.0 |
| 5 | 5 ±0.0 | 100±0.0 | ||
| 10 | 10±0.0 | 100±0.0 | ||
| Sea water | 1 | 1±0.0 | 100±0.0 | |
| 5 | 5±0.0 | 100±0.0 | ||
| 10 | 10±0.0 | 100±0.0 |
Robustness (pH, Volume of Analyte and Mass of AC Adsorbent Packed Column)
The robustness test of the AC packed column was performed by measuring the extraction percentage of TCP after slight change in various pH, volume of analyte and mass of AC as described. The recovery percentage (%E) of TCP measured at various pH (pH0.0-2.5) showed no significant differences (ΔE=E2– E1) between the recovery of the sample measured following the recommended procedures (E1) and results after slight change of pH (E2). Thus, AC packed column has acceptable working pH range adding further confirmation to the used adsorbent. The test was also performed by measuring the recovery percentage after slight changes in volume of the extraction media and mass of AC. Acceptable data were achieved as the differences in the percent recovery was ≤ ± 5%.
Conclusions and Future Perspectives
This manuscript offers a snapshot of the field of utilization of FA solid waste at this critical stage. AC prepared from FA solid waste has a great potential for portability and field applicability as an effective SPE for removal, enrichment and/or subsequent HPLC determination of CPs in water samples. Fast development in the field of utilization of FA in analytical chemistry will continue in the foreseeable future bringing solutions to many of the current CPs analysis challenges. The developed method offers LOD lower than maximum allowable level (MAL) of phenols in water set by WHO and favorably compared with LOD of many spectrochemical, chromatographic and electrochemical techniques. The method could be extended to pico-mole regime via online preconcetration methods. More work is necessary to: i) predict the performance of CPs removal from real effluents; ii) perform more work on phenol adsorption from mixed pollution effluents; iii) better understand mechanism of phenol retention on various adsorbents including AC and finally; iv) perform the feasibility study of various cost-effectiveness adsorbents at industrial scales at shorter reaction time. The results suggest a rationale techno-economic sense for an organization to a prudent environmental management program to assess the environmental impacts of global petroleum industry is of great importance (Ismail et al., 2013). AC packed column could be reused for 3 times without decrease in column performance.
Acknowledgements
The authors would like to thank King Abdul-Aziz City for Science and Technology (KACST) for financial support of this project (8-ENV124-3). The investigators would like also to thank the DSR, Prof M.A. Barakat and the Department of Chemistry, King Abdulaziz University (KAU) for their help and facilities provided. Special thanks to students and technicians whom assisted the investigators to perform the experimental work.
References
- Al-Degs Y. S., Ghrir A., Khoury H., Walker G. M., Sunjuk M., Al-Ghouti M. A. Characterization and utilization of fly ash of heavy fuel oil generated in power stations. Fuel Processing Technol. 2014;123:41–46.
CrossRef - Al-Ghouti M. A., Al-Degs Y. S., Ghrair A., Khoury H., Ziedan M. Extraction and separation of vanadium and nickel from fly ash produced in heavy fuel power plants. Chemical Engineering J. 2011;173:91–197.
CrossRef - Alhamed Y. A., Rather S. U., El-Shazly A. H., Zaman S. F., Daous M. A., Al-Zahrani A. A. Preparation of activated carbon from fly ash and its application for CO2 capture. Korean J. Chem. Eng. 2015;32(4):723-730.
CrossRef - Alonso-Hernández C. M., Bernal-Castillo J., Bolanos-Alvarez Y., Gómez-Batista M., Diaz-Asencio M. Heavy metal content of bottom ashes from a fuel oil power plant and oil refinery in Cuba. Fuel. 2011;90:2820–2823.
CrossRef - Andini S., Cioffi R., Colangelo F., Montagnaro F., Santoro L. Adsorption of chlorophenol chloroaniline and methylene blue on fuel oil fly ash. J Hazardous Materials. 2008;157(2-3):599-604.
CrossRef - Bailey S. E., Olin T. J., Bricka R. M., Adrian D. D. A review of potentially low-cost sorbents for heavy metals.Water Res. 1999;33:2469–2479.
CrossRef - Barakat M. A. New trends in removing heavy metals from industrial wastewater. Arabian J. Chemistry. 2011;4:361-377.
CrossRef - Baral S. S., Das S. N., Rath P., Roy G.,Chaudhury G. Chromium (VI) removal by Calcined Bauxite. Biochemical Eng. J. 2007;34:69-75.
CrossRef - Basheer C., Lee H. K. Analysis of endocrine disrupting alkylphenols, chlorophenols and bisphenol-A using hollow fiber-protected liquid-phase microextraction coupled with injection port-derivatization gas chromatography-mass spectrometry. J Chromatogr A. 2004;1057(1-2):163-169.
CrossRef - Bouzerara F., Harabi A., Achour S., Larbot A. Porous ceramic supports for membranes prepared from kaolin and doloma mixtures. J Eur Ceram Soc. 2006;26:1663–71.
CrossRef - Caoa J., Li X. D. L., Donga Y., Hampshire S. Recycling of waste fly ash for production of porous mullite ceramic membrane supports with increased porosity. J. Eur Ceramic Society. 2014;34(13):3181–3194.
CrossRef - El-Shahawi M. S., Hamza A., Al-Sibaai A. A., Al-Saidi H. M. Fast and Selective Removal of Trace Concentrations of Bismuth (III) from Water onto Procaine Hydrochloride Loaded Polyurethane Foams Sorbent: Kinetics and Thermodynamics of Bismuth (III) Study. Chemical Engineering J. 2011;173(2):29 -35.
CrossRef - Environmental Protection Agency’EPA Method 8041, Phenols by Gas Chromatography Capillary Column Technique. 1995;1-26.
- Gao J., Liu L., Liu X., Zhou H., Huang S., Wang Z. Levels and spatial distribution of chlorophenols, 2,4-Dichlorophenol, 2,4,6-trichlorophenol and pentachlorophenol in surface water of China. Chemosphere. 2008;71(6):1181-1187.
CrossRef - Gómez D., Santos M. D., Fujiwara F., Polla G., Marrero J., Dawidowski L., Smichowski P. Fractionation of metals and metalloids by chemical bonding from particles accumulated by electrostatic precipitation in an Argentine thermal power plant. Microchemical J. 2007;85:276–284.
CrossRef - Gomes H. T., Miranda S. M., Sampaio M. J., Silva A. M. T., Faria J. L. Activated carbons treated with sulphuric acid catalysts for catalytic wet peroxide oxidation. Catalyst Today. 2010;151:153–158.
CrossRef - Gokce Y., Aktas Z. Nitric acid modification of activated carbon produced from waste teaand adsorption of methylene blue and phenol. Applied Surface Science. 2014;313:352–359.
CrossRef - Ismail Z. I., Chuin T. J., Kuan K. K., Tai J. C., Kong K. K., Hing, L. K. H., Shirazi S. M., Karim R. Using data envelopment analysis in comparing the environmental performance and technical efficiency of selected companies in their global petroleum operations. Measurement. 2013;46(9):3401-3413.
CrossRef - Izquierdo M.T.,Rubio B. B. Carbon-enriched coal fly ash as a precursor of activated carbons for SO2 removal. J. Hazardous Materials. 2008;155:199-205.
CrossRef - Izquierdo M., Querol X. Leaching behavior of elements from coal combustion fly ash: An overview. International J. Coal Geology. 2012;94:54–66.
CrossRef - Komnitsas K., Zaharaki D. Geopolymerization: A review and prospects for the minerals industry. Minerals Engineering. 2007;20:1261–1277.
CrossRef - Kurniawan T. A., Babel S. A research study on Cr(VI) removal from contaminated wastewater using low-cost adsorbents and commercial activated carbon, Proceedings of the 2nd Intern. Conf. Energy Technology Towards a Clean Environment (RCETE). 2003;2:1110-1117.
- Limam I., Guenne A., Driss M. R and Mazéas L. Simultaneous determination of phenol, methylphenols, chlorophenols and bisphenol-A by headspace solid-phase microextraction-gas chromatography-mass spectrometry in water samples and industrial effluents. International Journal of Environmental Analytical Chemistry. 2010;90(3-6):230-244.
CrossRef - Liu R., Yuan J., Wang C. A novel way to fabricate tubular porous mullite membrane supports by TBA-based freezing casting method. J Eur Ceram Soc. 2013;33:3249–56.
CrossRef - Martínez D., Pocurull E., Marcé R. M., Borrull F., Calull M. Separation of eleven priority phenols by capillary zone electrophoresis with ultraviolet detection. J Chromatogr A. 1996;734(2):367-373.
CrossRef - Miller J. N., Miller J. C. Statistics and Chem ometrics for Analytical Chemistry 6th edn Ellis –Horwood Limited, NewYork, USA. 2010.
- Narin I., Soylak M., Dogan M. Trafic pollution in Nigide- Turkey: Investigation of trace element contents. Fresenius Environmental Bulletin. 1997;6:749-752.
- Nazari A., Bagheri A., Riahi S. Properties of geopolymer with seeded fly ash and rice husk bark ash. Materials Science and Engineering A. 2011;528:7395–7401.
CrossRef - Norris P., Chen C. W., Pan W. P. A technique for sequential leaching of coal and fly ash resulting in good recovery of trace elements. Anal Chim Acta. 2010;663:39-42.
CrossRef - Petrova B., Budinova T., Tsyntsarski B., Kochkodan V., Shkavro Z., Petrov N. Removal of aromatic hydrocarbons from water by activated carbon from apricot stones. Chemical Engineering Journal. 2010;165:258–264.
CrossRef - Pires M., Querol X. Characterization of Candiota (South Brazil) coal and combustion by-product. International J. Coal Geology. 2004;60:57–72.
CrossRef - Pizarro C., Pérez-del-Notario N., González-Sáiz J. M. Optimization of a microwave-assisted extraction method for the simultaneous determination of haloanisoles and halophenols in cork stoppers. J Chromatogr A. 2007;1149(2):138-144.
CrossRef - Rodr´ıguez I., Llompart M. P., Cela R. Solid-phase extraction of phenols. Journal of Chromatography A. 2009;885:291–304.
CrossRef - Salehin S., Aburizaiza A. S., Barakat M. A. Activated carbon from residual oil fly ash for heavy metals removal from aqueous solution. Desalination and Water Treatment. 2016;57(1):278-287.
- Tao H., Lei T., Shi G., Sun X. N., Wei X. Y., Zhang L. J., Wub W. M. Removal of heavy metals from fly ash leachate using combined bio electrochemical systems and electrolysis.J. Hazardous Materials. 2014;264:1–7.
CrossRef - van Jaarsveld G. S., van Deventer J. S. J., Lukey G. C. The effect of composition and temperature on the properties of fly ash and kaolinite-based geopolymers. Chemical Engineering J. 2002;89:63–73.
CrossRef - Visa M., Chelaru A. M. Hydrothermally modified fly ash for heavy metal and dyes removal in advanced wastewater treatment. Applied Surface Science. 2014;303:14-22.
CrossRef - Visa M., Duta A. TiO2/fly ash novel substrate for simultaneous removal of heavy metals and surfactants. Chem. Eng J. 2013;223:860-868.
CrossRef - Weber Jr W. J., Morris J. C. Kinetics of adsorption on carbon from solution. J. Sanit. Eng. Div. Proceed. Am. Soc. Civil Eng. 1963;89:31–59.
- Zhu L., Dong Y., Hampshire S., Cerneaux S., Winnubst L. Waste-to-resource preparation of a porous ceramic membrane support featuring elongated mullite whiskers with enhanced porosity and permeance. J. European Ceramic Society. 2015;35(2):711–722.
CrossRef

This work is licensed under a Creative Commons Attribution 4.0 International License.


