

How to Cite | Publication History | PlumX Article Matrix
Chandrasekar Raju1* , Sivagami Bojan2, Chandramouli Chinthaginjala2, Meena Dravidamani2, Aruna Kumari Dommaraju3and Kumanan Raghunathan4
1Faculty of Pharmacy, Department of Pharmacognosy, Seven Hills College of Pharmacy, Tirupati, Andhra Pradesh, India.
2 Faculty of Pharmacy, Department of Pharmaceutical Analysis, Seven Hills College of Pharmacy, Tirupati, Andhra Pradesh, India.
3Faculty of Pharmacy, Department of Pharmaceutics, Seven Hills College of Pharmacy, Tirupati, Andhra Pradesh, India.
4Faculty of Pharmacy, Department of Pharmacognosy, Devaki Amma Memorial College of Pharmacy, Malappuram, Kerala, India.
Corresponding Author E-mail:chandru@shcptirupati.edu.in
ABSTRACT: A QbD approach, with its emphasis on risk assessment and management, may result in the establishment of a more robust or rugged system. Critical quality attributes (CQAs) and the analytical target profile were evaluated by closely examining the detailed process for analytical QbD-based optimization parameters. RP- HPLC is considered more useful than normal phase HPLC method since it is more versatile in separating a wider range of compounds, due to its non-polar stationary phase and polar mobile phase, allowing for better control over Rt and mobile phase composition, with improved reproducibility and accuracy compared to normal phase HPLC. The current study outlines the invention and validation of the straightforward, quick, sensitive, and affordable RP-HPLC approach for investigating palovarotene in tablet formulations. Three essential elements of the RP-HPLC approach buffer pH, flow rate and ratio of MP were used in the Box-Behnken design factor screening investigations. The DOE trial version 12.0 was used to optimize the chromatographic settings. With water Platisil C18-EP (4.6 x 250 mm, 5µm) column and comprising of a mobile phase KH2PO4 (pH 3.5): ACN (50:50 ml) v/v, a 1.0 ml/min flow rate and UV range at 261 nm, the best chromatographic separation was accomplished. The interrelationships between MP, pH, and flow rate at 3 distinct levels are described by the Box–Behnken experimental design. RSM plots and statistical data were used to evaluate the retention duration and theoretical plate responses. The current RP-HPLC method for palovarotene was in compliance with the suggested ICH recommendations. The technique can also be utilized for quality control and laboratories evaluation aimed at the assessment of Palovarotene in the drug material and capsule formulation.
KEYWORDS: Analytical Quality by Design; Box Behnken Design; Fibrodysplasia Ossificans Progressive; Factors and Responses; Palovarotene
| Copy the following to cite this article: Raju C, Bojan S, Chinthaginjala C, Dravidamani M, Dommaraju A. K, Raghunathan K. Analytical Quality by Design Assisted Optimization of RP-HPLC Method for the Estimation of Palovarotene Drug Substance and Drug Product by Box–Behnken Design. Biotech Res Asia 2025;22(1). |
| Copy the following to cite this URL: Raju C, Bojan S, Chinthaginjala C, Dravidamani M, Dommaraju A. K, Raghunathan K. Analytical Quality by Design Assisted Optimization of RP-HPLC Method for the Estimation of Palovarotene Drug Substance and Drug Product by Box–Behnken Design. Biotech Res Asia 2025;22(1). Available from: https://bit.ly/4iblAh1 |
Introduction
Palovarotene (Sohonos, Ipsen, Paris, France) was approved by the USFDA on August 16, 2023, as a therapeutic option for fibrodysplasia ossificans progressive (FOP), after being approved in Canada in 2022. 1 By binding to the retinoic acid receptor γ (RARγ), palovarotene suppresses BMP signaling; hence, chondrogenesis and, ultimately, HO is hindered. 2 A bone morphogenetic protein (BMP) point mutation in the type I receptor is the cause of FOP, an incredibly rare autosomal dominant disorder. 3 Palovarotene is a selective agonist of the transcriptional repressor retinoic acid receptor gamma (RARγ), which is expressed in chondrocytes and chondrogenic cells. 1 Palovarotene suppresses the SMAD1/5/8 signaling pathway by reducing BMP signaling by its binding to RARγ. 2
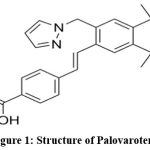 |
Figure 1: Structure of Palovarotene |
Palovarotene reduces muscle tissue damage by interfering with these pathways, which decreases chondrogenesis and permits normal muscle tissue repair. 3
No analytical techniques, including HPLC and UV, have been documented for the assessment of palovarotene in capsule formulation and API, and no studies on quality by design approach has been reported, according to literature reviews. Finding failure models and developing a reliable approach with adjustable design space for the duration of product life cycle management has been the main goal of AQbD 4.
The present research aims to use analytical QbD principles to establish and optimize the RP-HPLC approach for estimating the capsule formulation of palovarotene. To achieve high resilience and improve method performance, the QbD concept has been widely used in the assessment of analytical parameters. 5,6 QbD was discovered on the knowledge and application of (ICH Q8), (ICH Q9) and guidelines (ICH Q10). 7,8
Materials And Methods
Chemicals
The Palovarotene API was gifted by MSN Labs Pvt., Ltd, Hyderabad, India. The marketed capsule formulation of Sohonos (Palovarotene 5 mg) was used for assay. Potassium dihydrogen phosphate & acetonitrile HPLC grade were purchased from Sigma Aldrich, Mumbai, India.
Instruments and Equipment
The technique was developed using a HPLC (Shimadzu) equipped system with a quaternary pump, a sonicator, sample, detector (PDA) (software) LC solution. Weighing machine (Shimadzu).
Stock solution (Standard)
Palovarotene 25 mg was measured in 25 ml VF and mixed with CH3OH to prepare stock solution (1000μg/ml). By serially diluting this stock solution with methanol, several std solutions (10–60μg/ml) were enumerated. A nylon filter (0.45 μ) was used to filter the produced solution, and chromatographic analysis was performed to enumerate the calibration plot.
Sample solution Preparation
Desired amount 25 mg of palovarotene was measured and taken in a 25 ml VF, after adding 15 ml of methanol to the flask was shaken, sonicate it for 15 minutes. After shaking the flask, diluent was added to make it up to par. A nylon filter (0.45 μ) was used to filter the aforementioned solution. The sample solution was brought up to the mark with desired diluent solution to prepare a sample containing 20 μg/ml of Palovarotene and assessed.
Method Development by QBD Approach
Analytical target profile
The construction of the ATP, is critical to determining the variables required to guarantee the quality attributes and goal of the analytical process. The target profile for effective method development includes an analyst, sample, and a variety of analytical techniques.9
Critical Quality Attributes (CQA) Determination
CQAs are selected for AQbD analysis depends on the methods utilized to develop a method (RP-HPLC) and (e.g. assay and drug delivery assessment). The CQAs for the assay analysis procedure include tailing factor (Tf), plate count (N), resolution, Rt, and % recovery.10,11
Risk assessment and Identification of Critical Method Parameters (CMP) of the method
CMPs refer to analytical procedure sensitivity. The relationship between CMPs and CQAs is straightforward. CMPs are classified using a variety of analytical procedures such as GC, HPLC, and HPTLC. Column temperature, flow rate, injection volume, mobile phase pH, and organic modifier % are the various CMPs for developing RP-HPLC methods. Risk assessment evaluates the likelihood of subsequent failure and interactions with CMPs.11,12
Design of Experiment (DOE)
RSM model was chosen for DOE selection in contrast to factorial design. Because Box-Behnken provided a better interaction with a 3-factor and 3-level design with fewer runs than the BBD, it was selected for additional research. Three levels of Box–Behnken response surface design was used to optimize the method performance based on factor screening studies: low (−1), medium (0), and high (+1). CQAs (Rt and Tf) are chosen as dependent variables in DOE, while specific CMPs factors (pH of buffer, flow rate, and percentage organic modifier) are chosen as input variables (Table 1).12,13
Method development and Validation
Accuracy
The degree of agreement between the actual value and the discovered value is referred to as accuracy, also known as trueness. The % recovery was estimated by adding three different quantities of recognized standards to previously analysed samples.
Precision
Precision is the degree to which a series of measurements conducted under predetermined conditions with repeated samples of a different homogenous substance agree closely. It is referred to as %RSD.
Intermediate precision refers to the diversity within laboratories caused by different analysts, instruments, days, and so on. This is commonly referred to as method precision. Six separate sample results taken on six different days were used in the evaluation.
Linearity
A technique’s ability to analyse and deliver results proportional to the analyte concentration of the sample within a given range. To determine linearity, the regression equation of the calibration curve was used, which was derived from six linear standard concentrations.
Robustness
In terms of deliberate changes in method parameters, the method’s validity was tested by varying the mobile phase composition and flow rate.
LOD and LOQ
Detection and quantification limits were assessed for Palovarotene at 3:1 and 10:1 S/N ratio respectively, by analysing series of known concentration dilutions.
System suitability
System suitability testing was undertaken to ensure that the measurement system and analytical technique were appropriate for the proposed analysis. Six indistinguishable samples were tested.
Results
A DOE listing 17 runs was generated utilizing Stat Ease software. The BBD screening mechanism was used to investigate the various interaction and linear models of the buffer pH flow rate and MP ratio, on the retention period and tailing factor (Table 2-6). 14,15
HPLC Optimization by QbD approach
To optimize HPLC conditions, Rt, and theoretical plate (N), were chosen as ATPs. The BBD was utilized to refine the optimising numerous factors within the operational space. For the main impact of interaction, the quadratic model was used in the analysis. The optimized variables for the model are displayed in Table 2. For each CAA parameter, the model produces a quadratic equation. When the mobile phase ratio and pH decreases retention time will increase and also theoretical plate count increases. 9 The optimized method exhibited the mobile phase mixture comprising 50:50% v/v mix of KH2PO4: (pH 3.5) ACN and 1 ml/min flow rate achieved values close to 1.0 along with all the CAAs in the intended range (Figure 2-6). 16,17
Table 1: Optimization of parameters using BBD Design for Palovarotene
| Run | F1 Buffer pH | F2 Mobile Phase | F3 Flow Rate | R1 RT | R2 Plate Count |
| 1 | 3.50 | 50.00 | 1.00 | 3.7 | 19489 |
| 2 | 3.50 | 50.00 | 0.80 | 3.9 | 19589 |
| 3 | 4.50 | 30.00 | 0.90 | 2.1 | 12532 |
| 4 | 3.50 | 40.00 | 0.90 | 3.0 | 16452 |
| 5 | 2.50 | 40.00 | 0.80 | 2.0 | 13267 |
| 6 | 3.50 | 40.00 | 1.00 | 3.4 | 17234 |
| 7 | 3.50 | 40.00 | 1.00 | 3.4 | 17234 |
| 8 | 4.50 | 40.00 | 0.80 | 3.1 | 15765 |
| 9 | 3.50 | 40.00 | 1.00 | 3.4 | 17234 |
| 10 | 3.50 | 30.00 | 1.00 | 3.6 | 18678 |
| 11 | 3.50 | 40.00 | 0.90 | 3.4 | 17234 |
| 12 | 2.50 | 40.00 | 1.00 | 4.0 | 19699 |
| 13 | 4.50 | 40.00 | 1.00 | 2.9 | 14798 |
| 14 | 4.50 | 50.00 | 0.90 | 2.7 | 13987 |
| 15 | 3.50 | 30.00 | 0.80 | 4.1 | 19733 |
| 16 | 2.50 | 30.00 | 0.90 | 4.2 | 19853 |
| 17 | 2.50 | 50.00 | 0.90 | 4.4 | 19900 |
Table 2: Selection of Levels for BBD Design for Palovarotene
| Independent Variables | Levels | ||
| -1 | 0 | +1 | |
| buffer pH | 2.5 | 3.5 | 4.5 |
| Mobile Phase | 30 | 40 | 50 |
| Flow Rate | 0.8 | 0.9 | 1 |
Table 3: Fit Summary Response of Retention Time for Palovarotene
| Source | Sequential p-value | Lack of Fit p-value | AdjustedR² | PredictedR² | |
| Linear | < 0.0001 | 0.9071 | 0.8520 | ||
| 2FI | 0.9786 | 0.8815 | 0.6607 | ||
| Quadratic | < 0.0001 | 0.9943 | 0.9602 | Suggested | |
| Cubic | 1.0000 | Aliased |
Table 4: (R2) Plate Count of Palovarotene ANOVA for Quadratic model
| Sources | Sum of square | df | Mean square | F value | P value Prob>F | |
| Mean VsTotal | 5.627E+009 | 1 | 5.627E+009 | Suggested | ||
| Linear vsMean | 7.254E+006 | 3 | 2.418E+006 | 1.98 | 0.1662 | Suggested |
| 2F Vs linear | 1.668E+006 | 3 | 5.559E+005 | 0.39 | 0.7614 | |
| Quadratic | 1.236E+007 | 3 | 4.122E+006 | 15.93 | 0.0016 | |
| Cubic VsQuadra | 1.762E+006 | 3 | 5.874E+005 | 47.76 | 0.0014 | Aliased |
| Residual | 49203.20 | 4 | 12300.80 | |||
| Total | 5.650E+009 | 17 | 3.323E+008 |
Table 5: Response 1 Retention Time of Palovarotene ANOVA for Quadratic model
| Sources | Sum of square | df | Mean square | F value | P value Prob>F | |
| Mean VsTotal | 193.13 | 1 | 193.13 | Suggested | ||
| Linear vsMean | 2.02 | 3 | 0.63 | 1.60 | 0.2382 | Suggested |
| 2F Vs linear | 1.27 | 3 | 0.42 | 1.01 | 0.4289 | |
| Quadratic | 1.39 | 3 | 0.46 | 1.15 | 0.3930 | |
| Cubic VsQuadra | 2.69 | 3 | 0.90 | 27.99 | 0.0038 | Aliased |
| Residual | 0.13 | 4 | 0.032 | |||
| Total | 200.63 | 17 | 11.80 |
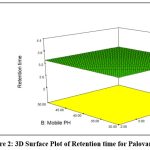 |
Figure 2: 3D Surface Plot of Retention time for Palovarotene |
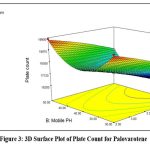 |
Figure 3: 3D Surface Plot of Plate Count for Palovarotene |
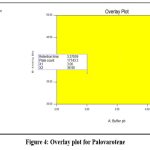 |
Figure 4: Overlay plot for Palovarotene. |
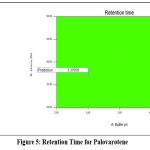 |
Figure 5: Retention Time for Palovarotene |
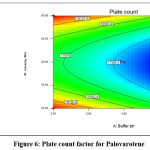 |
Figure 6: Plate count factor for Palovarotene Click here to view Figure |
System suitability
The Overall, system suitability parameters of Palovarotene were within the range and are acceptable as per ICH guidelines and are presented in Table 6 & Figure 7 Chromatogram of Blank, Figure 8 Chromatogram of Standard and Figure 9 Chromatogram of Sample.
Table 6: System Suitability studies for Palovarotene
| S.no | Name | RT (min) | Area (µV sec) | Height (µV) | USP tailing | USP plate count |
| 1 | Palovarotene(Standard) | 2.970 | 1843335 | 23449 | 1.15 | 5804 |
| 2 | Palovarotene(Sample) | 2.978 | 1716576 | 27492 | 1.14 | 5411 |
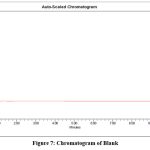 |
Figure 7: Chromatogram of Blank |
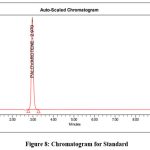 |
Figure 8: Chromatogram for Standard |
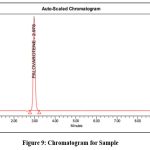 |
Figure 9: Chromatogram for Sample |
Method validation studies
Linearity
The technique’s linearity was recognized by plotting a calibration curve for the individual drug’s concentration level and their corresponding peak area. It was perceived on the concentration scale of 10- 50µg/ml of Palovarotene. The coefficient of determination, R2 was noticed to be not more than 0.999% and therefore the technique is linear. The respective results are given in Table 7. The calibration curves of Palovarotene are shown in Figure 10.
Table 7: Area of different concentration of Palovarotene
| S. No | Palovarotene | |
| Concentration (µg/ml) | Area | |
| 1 | 10 | 572192 |
| 2 | 20 | 1099896 |
| 3 | 30 | 1716576 |
| 4 | 40 | 2354708 |
| 5 | 50 | 2843335 |
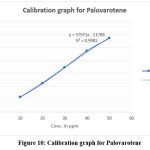 |
Figure 10: Calibration graph for Palovarotene |
Accuracy
Three concentrations levels 50%, 100% and 150% were considered for accuracy and the mean % recovery was 99.52 to 99.93 % for Palovarotene which was satisfactory and manifest the trueness of the technique. The results are as given in Table 8.
Table 8: Accuracy (recovery) data for Palovarotene
| %Concentration (at specification Level) | Area* | Amount Added (mg) | Amount Found (mg) | %
Recovery |
Mean Recovery |
| 50% | 858288 | 25 | 24.88 | 99.52 | 99.76 |
| 100% | 1716576 | 50 | 49.92 | 99.84 | |
| 150% | 2574864 | 75 | 74.95 | 99.93 |
Precision
Intermediate precision and Repeatability were considered and the % RSD was analysed to be within the acceptable range. The results are as given in Table 9.
Table 9: Results of Precision for Palovarotene
| Injection | Area | Injection | Area |
| Injection-1 | 1681068 | Injection-1 | 1671068 |
| Injection-2 | 1668199 | Injection-2 | 1668199 |
| Injection-3 | 1681077 | Injection-3 | 1681077 |
| Injection-4 | 1681077 | Injection-4 | 1671077 |
| Injection-5 | 1677489 | Injection-5 | 1677489 |
| Injection-6 | 1684877 | Injection-6 | 1684877 |
| Average | 1678965 | Average | 1675631 |
| Standard Deviation | 5768.549 | Standard Deviation | 6563.446 |
| %RSD | 0.34 | %RSD | 0.39 |
LOD and LOQ
The observed values of LOD were 0.3μg/ml and the LOQ were 1.0μg/ml respectively for the Palovarotene. Table 10 shows the LOD & LOQ values for Palovarotene.
Table 10. LOD & LOQ values of Palovarotene
| Drug name | Baseline noise(µV) | Signal obtained (µV) | S/N ratio | Conc. |
| Palovarotene | 93 | 276 | 2.96 | 0.3 µg/ml |
| Limit Of Quantification (LOQ) | ||||
| Palovarotene | 93 | 926 | 9.95 | 1.0 µg/ml |
Robustness
The technique’s robustness was evaluated by altering the organic phase and flow rate at the specified wavelength. The values acquired were presented and found to be satisfactory, indicating that the procedure remains robust. The results are presented in Table 12 & 13.
Table 11: Results for variation in flow for Palovarotene
| S. No | Flow Rate (ml/min) | System Suitability Results | |
| USP Plate Count | USP Tailing | ||
| 1 | 0.8 | 5405 | 1.13 |
| 2 | 1 | 5411 | 1.14 |
| 3 | 1.2 | 5415 | 1.09 |
Table 12: Results for variation in mobile phase composition for Palovarotene
|
S. No |
Change in Organic Composition in the Mobile Phase | System Suitability Results | |
| USP Plate Count | USP Tailing | ||
| 1 | 10 % less (45 ml) | 5405 | 1.13 |
| 2 | *Actual (50 ml) | 5411 | 1.14 |
| 3 | 10 % more (55 ml) | 5415 | 1.09 |
Applicability of developed method
99.79 % was the calculated mean % assay of Palovarotene respectively which was satisfactory and in good agreement with the % label claim for Palovarotene.
Discussion
A QbD approach, with its emphasis on risk assessment and management, may result in the establishment of a more robust or rugged system. Critical quality attributes (CQAs) and the analytical target profile were evaluated by closely examining the detailed process for analytical QbD-based optimization parameters. The present research sought to establish an accurate, simple, precise, robust, and appropriate methodology of QbD principles for the establishment of an RP-HPLC technique for estimating Palovarotene that is more robust and performs better. Three essential elements of the RP-HPLC approach buffer pH, flow rate and ratio of MP were used in the Box-Behnken design factor screening investigations. The BBD was applied to 3 independent and dependent variables at 3 levels using the Stat Ease trial version 12.0. With water Platisil C18-EP (4.6 x 250 mm, 5µm) column and comprising of a mobile phase KH2PO4 (pH 3.5): ACN (50:50 ml) v/v, a 1.0 ml/min flow rate and UV range at 261 nm, the best chromatographic separation was accomplished. The interrelationships between MP, pH, and flow rate at 3 distinct levels are described by the Box–Behnken experimental design. RSM plots and statistical data were used to evaluate the retention duration and theoretical plate responses. Each independent variables data design, which included ANOVA, perturbation and contour plots, and 3D model graphs, was reviewed. In this section, we examined how each element affected the response outcome. Using the ICH Q2 R1 criteria, the established RP-HPLC technology was linear, precise, accurate, robust. The lack of any desirable peak and no change in the drug’s retention time confirmed the usefulness of the established approach for quantifying Palovarotene in marketed capsules, suggesting that the method’s high specification and selectivity were reached.18-19 The current RP-HPLC method for palovarotene was in compliance with the suggested ICH recommendations. 20-22 The technique can also be utilized for quality control and laboratories evaluation aimed at the assessment of Palovarotene in the drug material and capsule formulation.
Conclusion
The present research aims to use analytical QbD principles to establish and optimize the RP-HPLC approach for estimating the capsule formulation of palovarotene. To achieve high resilience and improve method performance, the QbD concept has been widely used in the assessment of analytical parameters. Palovarotene has been estimated in API and marketed capsules using a precise, quick, accurate, and affordable analytical approach based on the QbD methodology. DOE is used to construct a complete statistical analysis and design spaces for the new approach, and the method is demonstrated to be robust for a larger range of situations. The technique can also be utilized for quality control and laboratories evaluation aimed at the assessment of Palovarotene in the drug material and formulation. It can be used efficiently for research analysis in organizations, industrial QC & QA departments, and accredited analytical laboratories.
Acknowledgement
Authors express their sincere gratitude to Seven Hills College of Pharmacy, Tirupati, for continuous motivation, support, and guidance for research activity and for providing all required facilities to accomplish the entitled work.
Funding Sources
The author(s) received no financial support for the research, authorship, and/or publication of this article.
Conflict of Interest
The authors do not have any conflict of interest.
Data Availability Statement
This statement does not apply to this article.
Ethics Statement
This research did not involve human participants, animal subjects, or any material that requires ethical approval.
Informed Consent Statement
This study did not involve human participants, and therefore, informed consent was not required.
Clinical Trial Registration
This research does not involve any clinical trials.
Author Contributions
Chandramouli Chinthaginjala: Conceptualization, Methodology,
Chandrasekar Raju: Writing – Original Draft.
Aruna Kumari DR: Data Collection, Analysis,
Chandrasekar Raju: Writing – Review & Editing.
Sivagami B: Visualization, Supervision,
Meena Dravidamani: Project Administration.
Kumanan Raghunathan: Funding Acquisition,
Sivagami B: Resources, Supervision.
References
- Talha, M., Ali, M.H. Palovarotene approved as first treatment for fibrodysplasia ossificans progressiva (FOP). J Rare Dis.2024; 3, 8. https://doi.org/10.1007/s44162-024-00032-3.
CrossRef - Hoy SM. Palovarotene: First Approval. Drugs. 2022;82(6):711-716. doi:10.1007/s40265-022-01709-z.
CrossRef - Susmitha, A., Rajitha, G., & Eri, G. K. A comprehensive review on QbD driven analytical procedures developed for the analysis of various drugs. Journal of Liquid Chromatography & Related Technologies, 2023; 46(1–5), 12–36. https://doi.org/10.1080/10826076.2023.2204238
CrossRef - Verch T, Campa C, Chéry CC. Analytical Quality by Design, Life Cycle Management, and Method Control. AAPS J. 2022;24(1):34. Published 2022 Feb 11. doi:10.1208/s12248-022-00685-2
CrossRef - Park G, Kim MK, Go SH, Choi M, Jang YP. Analytical Quality by Design (AQbD) Approach to the Development of Analytical Procedures for Medicinal Plants. Plants (Basel). 2022;11(21):2960. Published 2022 Nov 2. doi:10.3390/plants11212960
CrossRef - Bastogne T, Caputo F, Prina-Mello A, Borgos S, Barberi-Heyob M. A state of the art in analytical quality-by-design and perspectives in characterization of nano-enabled medicinal products. J Pharm Biomed Anal. 2022; 219:114911. doi: 10.1016/j.jpba.2022.114911
CrossRef - Shaik Ayesha Ameen, Nagaraju Pappula. Analytical QBD Approach to Redefine the Quality of Pharmaceuticals: A Review. J. Pharm. Res. 2023;22(4):178–185. https://doi.org/10.18579/ jopcr/v22.4.81
CrossRef - Patel, K., Shah, U.A. & Patel, C.N. Box–Behnken design-assisted optimization of RP-HPLC method for the estimation of evogliptin tartrate by analytical quality by design. Futur J Pharm Sci.2023;9, 57 (). https://doi.org/10.1186/s43094-023-00509-w
CrossRef - Alam P, Shakeel F, Taleuzzaman M, Foudah AI, et al. Box-Behnken Design (BBD) Application for Optimization of Chromatographic Conditions in RP-HPLC Method Development for the Estimation of Thymoquinone in Nigella sativaSeed Powder. Processes. 2022; 10(6):1082. https://doi.org/ 10.3390/pr10061082
CrossRef - Peraman R, Bhadraya K, Reddy YP, Reddy CS, Lokesh T. Analytical Quality by Design Approach in RP-HPLC Method Development for the Assay of Etofenamate in Dosage Forms. Indian J Pharm Sci. 2015;77(6):751-757. doi:10.4103/0250-474x.174971
CrossRef - Gupta A, Shetty S, Mutalik S, Navti PD, Saha M, Moorkoth S. Box-Behnken guided development of an ecofriendly RP-HPLC analytical method for simultaneous quantification of pantoprazole sodium and piperine co-loaded mucoadhesive GRDDS formulation for pylori eradication. J Appl Pharm Sci. 2024;14(09):098–110. http://doi.org/10.7324/JAPS.2024.179147
CrossRef - Patel, K.Y., Dedania, Z.R., Dedania, R.R. QbD approach to HPLC method development and validation of ceftriaxone sodium. Futur J Pharm Sci., 2021; 7, 141. https://doi.org/10.1186/s43094-021-00286-4.
CrossRef - Shukla RR, Chaudhary A, Patel P, Detholia K. QbD based RP-HPLC method development for quantitative computation of phase III composition comprising apixaban and clopidogrel. J Appl Pharm Sci. 2024;14(08):085–093. http://doi.org/10.7324/JAPS.2024.181311
CrossRef - Shamim A, Ansari MJ, Aodah A. QbD-Engineered Development and Validation of a RP-HPLC Method for Simultaneous Estimation of Rutin and Ciprofloxacin HCl in Bilosomal Nanoformulation. ACS Omega. 2023;8(24):21618-21627. Published 2023 Jun 8. doi:10.1021/acsomega.3c00956
CrossRef - Saini S, Sharma T, Patel A. QbD-steered development and validation of an RP-HPLC method for quantification of ferulic acid: Rational application of chemometric tools. J Chromatogr B Analyt Technol Biomed Life Sci. 2020; 1155:122300. doi: 10.1016/j.jchromb.2020.122300
CrossRef - Nuli, M.V., Seemaladinne, R. & Tallam, A.K. Analytical quality by design (AQbD) based optimization of RP-UPLC method for determination of nivolumab and relatlimab in bulk and pharmaceutical dosage forms. Futur J Pharm Sci. 2024;10, 86. https://doi.org/10.1186/s43094-024-00659-5.
CrossRef - Sathuluri, K., Bakam, R., Jain, R. Analytical quality by design (AQbD) in the ICHQ14 guidelines for analytical procedure development. Accred Qual Assur. 2024; https://doi.org/10.1007/s00769-024-01587-w
CrossRef - Tim Tome Nina Žigart Zdenko Časar Aleš Obreza. Development and Optimization of Liquid Chromatography Analytical Methods by Using AQbD Principles: Overview and Recent Advances Org. Process Res. Dev., 2019; 23, 9, 1784–1802. https://doi.org/10.1021/acs.oprd.9b00238
CrossRef - Sivagami B, Sailaja B. Determination of phytochemical markers andrographolide, eugenol and zingerone in nilavembu kudineer by RP-HPLC method. J Appl Pharm Sci. 2024;14(10):128–134. http://doi.org/10.7324/JAPS.2024.180359
CrossRef - More MP, Pardeshi SR, Tade R, Meshram PD, Naik JB, Deshmukh PK. Development of an Analytical Quality by Design RP-HPLC Method and Its Validation for Estimation of Gefitinib From Bulk, Tablet Dosage Form, and Complex Nanoformulation. J AOAC Int. 2024;107(4):558-570. doi:10.1093/jaoacint/qsae033
CrossRef - Shah J, Kotadiya R, Patel R. Analytical Quality by Design-Based Robust RP-HPLC Method for Quantitative Estimation of Pregabalin and Etoricoxib in Fixed-Dose Combination Tablet Formulation. J AOAC Int. 2022;105(6):1536-1547. doi:10.1093/jaoacint/qsac082
CrossRef - Suryawanshi SS, Palled MS. Box-Behnken Design Assisted Optimization and Standardization of Chromatographic Methodology for Quality Assessment of Metformin: Analytical Quality by Design Avenue. Indian J of Pharmaceutical Education and Research. 2022;56(2s): s152-s162.
CrossRef

This work is licensed under a Creative Commons Attribution 4.0 International License.


