

How to Cite | Publication History | PlumX Article Matrix
RP-HPLC Method Development and Validation of Dronedarone Hydrochloride in Bulk and Dosage Form
Rutika Bapu Waghchaure* , Shivraj Popat Jadhav , Khemchand Rajendra Surana , Darshan Sharad Sonawane and Sunil Kashinath Mahajan
Pharmaceutical Quality Assurance, Divine College of Pharmacy, Savitribai Phule Pune University, Satana, Nashik, Maharashtra, India.
Corresponding Author E-mail:rutikawaghchaure2018@gmail.com
ABSTRACT: Dronedarone's presence in drugs and dosage formulations has been identified using spectrophotometric and HPLC methods in a number of papers. The study developed a reliable reversed-phase high performance liquid chromatography method to measure dronedarone in bulk medication and tablet formulations. The method uses a UV detector and Openlab EZ chrome software, ensuring accuracy, precision, and robustness in filter study, solution stability, and quantification.
KEYWORDS: Development; Dilsave; Dronedarone; Methanol; RP-HPLC; Validation
| Copy the following to cite this article: Waghchaure B. B, Jadhav S. P, Surana K. R, Sonawane D. S, Mahajan S. K. RP-HPLC Method Development and Validation of Dronedarone Hydrochloride in Bulk and Dosage Form. Biotech Res Asia 2025;22(1). |
| Copy the following to cite this URL: Waghchaure B. B, Jadhav S. P, Surana K. R, Sonawane D. S, Mahajan S. K. RP-HPLC Method Development and Validation of Dronedarone Hydrochloride in Bulk and Dosage Form. Biotech Res Asia 2025;22(1). Available from: https://bit.ly/4hmOdqU |
Introduction
In the pharmaceutical sector, analytical methods validation serves as proof that the procedures are appropriate for the task; these procedures must follow a plan that specifies acceptance limits, performance characteristics, and scopes. It is necessary to validate or revalidate analytical procedures before incorporating them into regular analysis1. Chromatography is an analytical method that separates molecules according to structural or compositional variations. Chromatography typically entails passing a sample over a stationary phase inside the apparatus. Due to their interactions and varying affinities for the stationary support, the molecules in the samples will segregate. Analytical chemistry Investigates, detects, and quantifies matter using tools and techniques. In actuality, the analysis may consist solely of separation, identification, or quantification, or it may be paired with another technique2,3. Analysis separates the analytes. Analytes are identified through qualitative examination, and the concentration or numerical amount is ascertained through quantitative analysis. Qualitative analysis can determine the presence or absence of a compound, but not its mass or concentration, as they are not quantitative in nature 4.
Drug profile
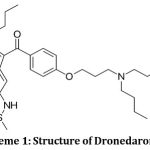 |
Scheme 1: Structure of Dronedarone5 |
Material andmethods Materials
Drug: Dronedarone
Drug is taken from Vidisha analytical.
Reagents: some chemicals and solvents are used,
Methanol from Merk
Acetonitrile from Merk
Water from siddhi laboratory
Instruments
Instruments that were utilized is UV – visible spectrophotometer
The Jasco Model 550 double beam UV-visible spectrophotometer is a reliable and efficient tool for analyzing various types of UV-visible data6.
HPLC system
Agilent’s 1260 Infinity II model number, DEAX02386 pump, and DEACX16446 detector are all in use.
KromasilC18 is a 250 x 4.6 mm, 5 µm column that runs on open lab EZ Chrome software.
Table 1: Trial of solution with their chromatographic condition of drug dronedarone
| Trial | Standar d dissolut ion | Colum n | Column dimensio n | Colum n oven temp. | detecto r | wav elen gth | Flo w rate | Mobile phase | Injection volume |
| 1. | Droneda rone 100PPM | Pheno menex C18, | (250 mm X4.6 mm i.d.) 5μm | 40°C | U.V.Detector | 288nm | 1.0ml/ min | Methanol: water (70:30) | 20μl |
| 2. | Droneda rone 100PPM | Pheno menex C18, | (250 mm X4.6 mm i.d.) 5μm | 40°C | U.V.Detector | 288nm | 1.0ml/ min | Acetonitril e: water (70:30) | 20μl |
| 3. | Droneda rone 100PPM | Pheno menex C18, | (250 mm X4.6 mm i.d.) 5μm | 40°C | U.V.Detector | 288nm | 1.0ml/ min | Methanol: 0.05% OPAin Water (70:30) | 20μl |
| 4. | Droneda rone 100PPM | Pheno menex C18, | (250 mm X4.6 mm i.d.) 5μm | 40°C | U.V.Detector | 288nm | 1.0ml/ min | Methanol: 0.05% OPAin Water (65:35) | 20μl |
Optimal Chromatographic Conditions: Trial No. 4 is regarded as having optimal chromatography, and it looks like this,
Chromatographic Conditions
Column Dimensions: (250 mm x 4.6 mm i.d.) Column Type: Phenomenex C18 5 μm Temperature of column oven: 40 °C
The detector is a UVdetector. 288 nm is the wavelength. Rate of Flow: 1.0 ml/min
Phase of mobility: Methanol: 65:35 water with 0.05% OPA Injection 20 μl of volume
Sample preparation of Marketed test sample
After being weighed, twenty tablets were moved to a pestle and mortar and ground into a fine powder. Equally combine the ingredients with the butter paper. Once 50 mg of Dronedarone had been weighed out of the powder, it was placed to a 100 mL volumetric flask that had been cleaned and let to dry. After adding 70 milliliters of methanol, the liquid was sonicated by erratic shaking for ten minutes. Allow the solution to reach room temperature after ten minutes, then add methanol to bring the volume up to the proper level. Three to five milliliters of the first filtrate were thrown away after the mixture was filtered using an appropriate 0.45 µ syringe filter.
After adding 20 milligrams of Dronedarone to the mobile phase to dilute the filtered stock solution to a volume of 25 milliliters, the mixture was injected, and the chromatograms and outcomes were noted.
Table 2: The sample was prepared in duplicate and the summary of the preparation process is provided below
| Sample | Sample (mg) | Diluted to (mL) | Volume taken | Diluted to (mL) |
| Sample 1 | 96.7 | 100 | 1 | 25 |
| Sample 2 | 97.2 | 100 | 1 | 25 |
Formula for % Assay calculation
Validation of Rp-Hplc Method
The Dronedarone estimate method has been validated for certain parameters in accordance with ICH guidelines.
Filtration Study
An analytical procedure’s filtration investigation evaluates a filter’s compatibility with the sample, its deposition on the filter bed, and interference from extraneous components7.
Stability of Analytical Solution
The stability analysis was conducted on both the test sample and standard solution in a typical laboratory setting, evaluating the solution under standard lighting conditions after 12 and 24 hours 8.
Specificity
Specificity is the ability to accurately detect an analyte in the presence of expected components.
The next step is to prepare and inject the solution to demonstrate the method’s specificity9.
(Peak purity for test sample and standard solution checked)
Blank (diluent: mobile phase)
Placebo
The standard dronedarone solution
Sample solution for tablet testing10.
Linearity and Range
Preparation of linearity solution
Linearity refers to an analytical procedure’s ability to produce test results proportionate to the analyte concentration within a given range, with five linearity levels tested 11.
Linearity Dronedarone stock solution
20 milliliters of methanol were used to dissolve 21.30 milligrams of Dronedarone hydrochloride, which is equal to 20 milligrams of Dronedarone. To create 50 mL, 2.5 ml of the stock solution were further diluted with mobile phase 12. (Parts per million of 50)
Table 3: Linearity levels preparation
| Sr. No. | Level (%) | mL of stock solution | Diluted to with mobile phase (mL) | Dronedarone Concentration(µg/mL) |
| 1 | 10% | 0.4 | 10 | 2.00 |
| 2 | 50% | 2.0 | 10 | 10.00 |
| 3 | 100% | 4.0 | 10 | 20.00 |
| 4 | 125% | 5.0 | 10 | 25.00 |
| 5 | 150% | 6.0 | 10 | 30.00 |
Determination
The mean area was calculated after each level was administered three times. The calibration curve was plotted as mean area on the y-axis against analyte concentration in µg/mL on the X- axis based on the results.
Acceptance criteria
NLT 0.98 is the correlation coefficient. Interception: To be documented
Slope: To be reported
Limit of Detection (LOD) and Limit of Quantitation (LOQ)
The detection limit of an analytical technique refers to the lowest concentration of analyte in a sample that can be identified but may not always be accurately measured 13.
Quantitation limit
The quantitation limit of an analytical technique is the lowest concentration in a sample that can be accurately identified, and LOD and LOQ are computed in accordance with ICH Q2R1 recommendations 14.
The calibration curve was utilized to determine the residual standard deviation of a regression line, and the LOD and LOQ were determined using the following formula 15.
LOD = 3.3 σ / S
LOQ = 10 σ / S
Were,
σ = represents the regression line’s residual standard deviation.
S = Slope of regression line
Accuracy (% Recovery)
The analytical procedure’s accuracy is determined by the degree of agreement between the discovered and recognized value, with a working concentration of 50-50% and three copies of each accuracy level 16.
Accuracy levels details
Refer Following table for each sample
Table 4: Accuracy levels
| Level (%) | Dronedarone HCl Std (mg) | Placebo (mg) | Diluted to (mL) | Volume taken (mL) | Diluted to (mL) | Dronedarone Concentration (µg/mL) |
| 50 | 26.8 | 43.9 | 100 | 1 | 25 | 10.07 |
| 26.9 | 43.7 | 100 | 1 | 25 | 10.10 | |
| 26.7 | 44.2 | 100 | 1 | 25 | 10.03 | |
| 100 | 53.4 | 44.1 | 100 | 1 | 25 | 20.06 |
| 53.3 | 43.8 | 100 | 1 | 25 | 20.02 | |
| 53.4 | 44.3 | 100 | 1 | 25 | 20.06 | |
|
150 |
79.9 | 43.9 | 100 | 1 | 25 | 30.01 |
| 80.1 | 43.7 | 100 | 1 | 25 | 30.09 | |
| 80.0 | 44.1 | 100 | 1 | 25 | 30.05 |
Acceptance criteria
The mean recovery and the percentage recovery for every sample should fall between 98 and 102%.
The recommended relative standard deviation is no more than 2.0%.
Precision
Analytical method precision refers to the agreement between measurements from multiple samplings of a homogenous test, with intermediate precision and repeatability being the two types 17.
Repeatability
Table 5: Precision (Repeatability) Sample details are as follows
| Sample No. | Test powdermaterial (mg) | Diluted to (mL) | Volume taken(mL) | Diluted to (mL) |
| 1 | 97.2 | 100 | 1 | 25 |
| 2 | 96.9 | 100 | 1 | 25 |
| 3 | 97.3 | 100 | 1 | 25 |
| 4 | 97.1 | 100 | 1 | 25 |
| 5 | 96.8 | 100 | 1 | 25 |
| 6 | 97.4 | 100 | 1 | 25 |
Acceptance criteria
Each sample’s 90% to 110% as well as the average assay value RSD percentage: NMT 2% for the six-sample assay
Intermediate precision
Analysis is done on a different day to confirm that the results are repeatable. Using the same process as the Repeatability parameter, six samples were created 18.
Table 6: Intermediate Precision Sample details are as follows
| Sample No. | Test powder material (mg) | Diluted to (mL) | Volume taken(mL) | Diluted to (mL) |
| 1 | 96.9 | 100 | 1 | 25 |
| 2 | 97.2 | 100 | 1 | 25 |
| 3 | 96.8 | 100 | 1 | 25 |
| 4 | 97.4 | 100 | 1 | 25 |
| 5 | 97.1 | 100 | 1 | 25 |
| 6 | 97.3 | 100 | 1 | 25 |
Acceptance criteria
90% to 110% for each sample and the average assay value
Percentage RSD for six samples of intermediate precision assay: NMT 2
% RSD for each of the 12 samples: 6 tests for intermediate precision and 6 tests for repeatability; NMT 2% for test outcomes.
Robustness
Robustness is a statistic that conveys how reliable an analytical procedure is under typical operating conditions and how resistant it is to tiny, intentional changes in method parameters 19.
Determination: The Blank and Standard solutions were injected using a variety of chromatographic conditions, as shown below 20.
Variation of ±10% in the flow (± 0.1 ml/min)
Temperature of the column oven has (± 2ºC)
Wavelength variation (± 3 nm).
Results
Preliminary Characterization and Identification of Drug
Color, odour and appearance
Table 7: Color, odour and appearance of Drug
| Sr. No | Name | Colour, odour and appearance of drug |
| 1 | Dronedarone hydrochloride | White, odorless and Crystalline powder |
Melting point determination
Table 8: Melting point of Drug
| Sr.No. | Name | Melting point std. value (°C) | Melting point observed (°C) |
| 1 | Dronedarone hydrochloride | 142-146 °C | 144-148 °C |
Solubility study
Table 9: Solubility study of Dronedarone hydrochloride
| Sr.No. | Nameof Solvent | Observation | Conclusion | Summary |
| 1 | Water | Drug Particles seen | Drug was not | The stock solution is prepared using methanol as a diluent. |
| after sonication | foundsoluble in water. | |||
| 2 | Methanol | No Drug Particles seen after sonication. | Drugwas found soluble in methanol. |
Selection of solvent
Methanol was selected as the solvent for dissolving Dronedarone hydrochloride.
Table 10: Optimized Chromatographic Conditions:
| Parameter | Description |
| Mode | Isocratic |
| Column Name | Phenomenex C18, 250mm*4.6mm, 5μ |
| Detector | UV Detector |
| Injection Volume | 20 μl |
| wavelength | 288nm |
| Column Oven temp | 40ºC |
| Mobile Phase | Methanol: 0.05% OPA in Water (65:35 % V/V) |
| Flow Rate | 1.0 ml/min |
| Run time | 8 minutes |
Table 11: Results for System Suitability Test of Dronedarone
| Sr.no | Standard solution | Area | Asymmetry | Theoretical plates |
| 1 | Standard 1 | 8442067 | 1.21 | 7058 |
| 2 | Standard 2 | 8463658 | 1.21 | 7043 |
| 3 | Standard 3 | 8456980 | 1.21 | 7047 |
| 4 | Standard 4 | 8420621 | 1.21 | 7064 |
| 5 | Standard 5 | 8476790 | 1.21 | 7069 |
| Mean | 8452023 | 1.21 | 7056 | |
| STD Dev. | 21555.49178 | |||
| % RSD | 0.26 |
 |
Figure 1: The standard solution 1 of the system suitability solution is a typical chromatogram. |
Table 12: Dilsave tablet assay result
| Assay results of Dilsave 400mg tab let sample | Area | % Assay | Mean assay |
| Sample 1 | 8269685 | 98.06 | 98.50 |
| Sample 2 | 8386850 | 98.94 |
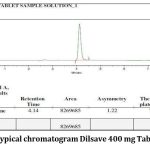 |
Figure 2: Typical chromatogram Dilsave 400 mg Tablet sample. |
Table 13: Result of filter study
| Results of Filter study Sample description | Area | % Absolute difference |
| Unfiltered | 8453581 | NA |
| 0.45 μ PVDF filter | 8416258 | 0.44 |
| 0.45 μ Nylon filter | 8432560 | 0.25 |
Table 14: Results of Solution stability.
| Sample solution timepoint | Area | %Absolute difference | Standard solution timepoint | Area | %Absolute difference |
| Initial | 8449658 | NA | Initial | 8465823 | NA |
| 12 Hours | 8425260 | 0.29 | 12 Hours | 8443582 | 0.26 |
| 24 Hours | 8401704 | 0.57 | 24 Hours | 8428060 | 0.45 |
Table 15: Results of specificity description
| Results of specificity description | Observation |
| Blank | Due to blank, there is no interference at R.T. of Dronedarone |
| Placebo | No placebo-induced interference at R.T. of Dronedarone |
| Standard solution | The highest purity was 0.987. |
| Test solution | The highest purity was 0.981. |
Table 16: Linearity data for dronedarone level
| Linearity Data for Dronedarone Level | Concentration(μg/mL) | Area | Mean | % RSD |
| 10% | 2.00 | 826151827692
825207 |
826350 | 0.152 |
| 50% | 10.00 | 42080754213620
4219894 |
4213853 | 0.140 |
| 100% | 20.00 | 84390968427679
8450680 |
8439152 | 0.136 |
| 125% | 25.00 | 1041317510438940
10420807 |
10424307 | 0.127 |
| 150% | 30.00 | 1256548812540843
12578304 |
12561545 | 0.152 |
Chromatograms
 |
Figure 3: Typical chromatogram of Linearity 10%. |
 |
Figure 4: Typical chromatogram of Linearity 50%. |
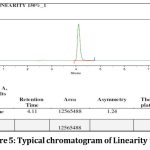 |
Figure 5: Typical chromatogram of Linearity 150%. |
 |
Figure 6: Calibration curve of Dronedarone |
Table 17: Data of linearity of Dronedarone
| Sr no. | Parameter | Result value | Acceptance criteria |
| 1 | Beer’s linearity range | 2.0 -30.0 µg/mL | NA |
| 2 | Correlation coefficient (R2) | 0.99996 | NLT 0.98 |
| 3 | Intercept | 13759.060 | To be report |
| 4 | Slope | 418334.9181 | To be report |
| 5 | % RSD for area at each level | NA | NMT 2.0 |
Table 18: Result and statistical data of Accuracy of Dronedarone
| Level (%) | Area | Recovered conc (µg/mL) | Added conc (µg/mL) | %Recovery | Mean Recovery | % RSD |
| 50 | 4190251 | 9.92 | 10.07 | 98.51 | 98.94 | 0.589 |
| 4250485 | 10.06 | 10.10 | 99.60 | |||
| 4183840 | 9.90 | 10.03 | 98.70 | |||
| 100 | 8490256 | 20.09 | 20.06 | 100.15 | 99.27 | 0.858 |
| 8330475 | 19.71 | 20.02 | 98.45 | |||
| 8411823 | 19.90 | 20.06 | 99.20 | |||
|
150 |
1256405 | 29.73 | 30.01 | 99.07 |
99.07 |
0.636 |
| 7 | ||||||
| 12679430 | 30.00 | 30.09 | 99.70 | |||
| 1250160 | 29.58 | 30.05 | 98.44 | |||
| 9 |
Chromatograms
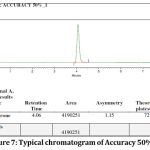 |
Figure 7: Typical chromatogram of Accuracy 50%. |
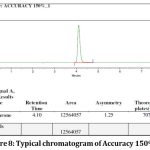 |
Figure 8: Typical chromatogram of Accuracy 150%. |
Table 19: Result of Intra- day and Inter- Day Precision for Dronedarone test sample assay
|
Repeatability |
Sample | Test Sample (mg) | Area | % Assay | |
| Sample 1 | 97.2 | 8330682 | 98.28 | ||
| Sample 2 | 96.9 | 8430648 | 99.76 | ||
| Sample 3 | 97.3 | 8306720 | 97.89 | ||
| Sample 4 | 97.1 | 8352358 | 98.63 | ||
| Sample 5 | 96.8 | 8478516 | 100.43 | ||
| Sample 6 | 97.4 | 8315835 | 97.90 | ||
| Mean | 98.82 | ||||
| STD DEV | 1.050195 | ||||
| % RSD | 1.063 | ||||
| Intermediate precision (Inter-Day) | Sample 1 | 96.9 | 8482361 | 100.38 | |
| Sample 2 | 97.2 | 8313504 | 98.07 | ||
| Sample 3 | 96.8 | 8242860 | 97.64 | ||
| Sample 4 | 97.4 | 8413692 | 99.05 | ||
| Sample 5 | 97.1 | 8283025 | 97.81 | ||
| Sample 6 | 97.3 | 8467921 | 99.79 | ||
| Mean | 98.79 | ||||
| STD DEV | 1.131106 | ||||
| % RSD | 1.145 | ||||
| Repeatability Plus Inter-day | Mean | 98.803 | |||
| STD DEV | 1.04069 | ||||
| % RSD | 1.053 | ||||
Table 20: Result of Robustness study of Dronedarone
| Change in Parameter | R.T. | Standard area | Asymmetry | Theoretical plates |
| Wavelength by +3 NM (291 NM) | 4.05 | 7938226 | 1.22 | 7289 |
| Wavelength by -3 NM (285 NM) | 4.03 | 7844385 | 1.19 | 7281 |
| Flow rate by +10% (1.1 mL/min) | 3.66 | 7336241 | 1.18 | 6743 |
| Flow rate by -10% (0.9 mL/min) | 4.48 | 9010416 | 1.21 | 7566 |
| Column oven temp by +2ºC (42 ºC) | 4.13 | 8410892 | 1.23 | 6936 |
| Column oven temp by -2ºC (38 ºC) | 4.12 | 8435691 | 1.21 | 7083 |
Discussion
System suitability test
System Suitability Acceptance Criteria
The analyte peak area’s relative standard deviation in standard chromatograms shouldn’t be more than 2.0%.
There should be at least 2000 theoretical plates of analyte peak in standard
The analyte peaks’ tailing factor (asymmetry) in standard chromatograms should be less than 2.0.
Data interpretation
As can be seen from the data given above, the procedure conforms to the requirements for system appropriateness. Therefore, it may be said that the intended analysis can be conducted using the chromatographic method.
Analysis of Marketed Test samples (Assay)
Dilsave 400 mg Tablet
Weight of 20 tablets = 15.5060 gm.
Average weight of tablet = 15.5060 /20 = 0.7753 gm. = 775.3 mg
Acceptance criteria
The assay found should fall within the 90-110% range.
Data interpretation
Based on the aforementioned findings, it can be said that the sample can be utilized for validation because the assay result for the chosen commercial test sample is within the acceptable range.
Validation of Rp-Hplc Method
Filtration Study
The analytical technique’s filtration inquiry assesses the filter’s compatibility with the sample, deposition on the filter bed, and interference from extraneous components on a tablet test sample.
Acceptance criteria
The absolute difference between filtered samples and unfiltered samples is calculated using NMT 2.0.
Data interpretation
PVDF and Nylon filters are both suitable for use as they meet the requirements for filter studies. Since nylon showed smaller absolute difference than PVDF filter, we chose to utilize it.
Solution Stability
The stability analysis was conducted on both test and standard samples in a typical laboratory setting, examining the solution after six, twelve, and twenty four hours under standard laboratory lighting.
Acceptance criteria
NMT 2.0’s absolute stability solution differs from the first solution in percentage terms.
Data interpretation
Testing and standard solutions were proven to be steady for a whole day. Therefore, you can use both solutions for up to 24 hours.
Specificity
Specificity is the ability to accurately detect an analyte in the presence of expected components.
A standard solution was prepared and injected to ensure peak purity.
Acceptance criteria
Blank: There shouldn’t be any disruption at Dronedarone’s R.T. Placebo: At R.T. of Dronedarone, there shouldn’t be any interference. Sample solutions for testing and standards: Maximum purity: 0.95 NLT
Interpretation of the data
The chromatographic technique for Dronedarone met specificity requirements, with both standard and test solutions’ purity peaks within acceptable bounds, without interference from blank or placebo.
Linearity and Range
Linearity is an analytical method’s ability to produce test results directly proportional to the concentration of the analyte in the samples.
The respective linear equation for Dronedarone
Y = M X + C
Y = 418334.9181 x + 13759.060
Where, x = concentration of Analyte in µg/mL
y = is area of peak.
M = Slope C=Intercept
Conclusion
The Dronedarone demonstrated a linear response within the 2.0-30.0 μg/ml range, with a regression value within the limit.
Limit of Detection (LOD) and Limit of Quantitation (LOQ)
σ = 40611.40658 (Residual standard deviation of a regression line)
s = 418334.9181
Detection limit (LOD)
LOD = 3.3 σ / S
LOD = 3.3 x 40611.40658 / 418334.9181
LOD = 0.320 µg/mL
Quantitation limit (LOQ)
LOQ = 10 σ / S
LOQ = 10 x 40611.40658 / 418334.9181
LOQ = 0.971 µg/mL
ACCURACY (RECOVERY)
An analytical method’s accuracy is determined by its closeness to the true value, achieved by applying the method to samples with known analyte amounts.
Overall Recovery: 99.09 %
% RSD for Overall Recovery: 0.627
Acceptance criteria
The recovery rate for each level and overall recovery ranges from 98.0 to 102.0%. The percentage RSD for each level and overall recovery rate for NMT 2.0 is provided. Data interpretation:
The analytical procedure’s recovery was found to be within acceptable criteria at all three levels, and the recovery was not affected by changes in analyte concentration.
Precision
The precision of an analytical method refers to the agreement among individual test results when applied to multiple samplings of a homogenous sample, usually expressed as standard deviation or relative standard deviation.
Acceptance criteria
% Assay: The mean assay value for precision (6 samples), intermediate precision (6 samples), and precision plus intermediate precision (12 samples) ranges from 90-110%.
% RSD: The NMT 2.0 was utilized to calculate the % RSD for precision, intermediate, and precision plus intermediate precision samples.
Data interpretation: The method was found tobe precise and reproducible, with the % Assay and % RSD falling within the acceptance limit.
Robustness
An analytical method’s robustness signifies its ability to withstand minor parameter changes, indicating its reliability during normal usage.
The following modifications have been made under the category of Robustness.
Change in Wavelength
Change in flow rate
Change in column oven temperature
Acceptance criteria
The system suitability acceptance criteria for chromatography should not be failed.
Data interpretation
The system suitability test results were found to be within the limits, indicating a robust analytical method.
Conclusion
The current work’s objective was to create a suitable, accurate, precise, and simple RP-HPLC method.
A survey of the literature revealed that several methods for quantifying dronedarone in bulk or prescription dosage forms have been reported.
In the current work, a new, sensitive, and suitable reversed-phase high performance liquid chromatography method was developed and validated in order to determine dronedarone in bulk dosage form. The developed RP-HPLC technique resolved the analyte using an isocratic procedure.
Acknowledgment
I take this opportunity with pride and enormous gratification to express the feelings of thanks and gratitude from the core of my heart to all individuals who abided with me directly and indirectly throughout the lean and lush phases during the materialization of this thesis.
I would like to thank to our Divine College of pharmacy, Satana for is valuable guidance.
I am also thankful to Vidisha analytical lab providing support and platform for project work.
Funding Sources
The author(s) received no financial support for the research, authorship, and/or publication of this article.
Conflict of Interest
The authors do not have any conflict of interest.
Data Availability Statement
This statement does not apply to this article.
Ethics Statement
This research did not involve human participants, animal subjects, or any material that requires ethical approval.
Informed Consent Statement
This study did not involve human participants, and therefore, informed consent was not required.
Clinical Trial Registration
This research does not involve any clinical trials.
Authors contribution
Rutika B. waghchaure: Data collection, writing original draft, methodology Shivraj P. Jadhav: Project administration, Analysis, writing review and editing Khemchand R. surana: Visualization
Darshan S. sonawane: Data collection, editing of data. Sunil K. Mahajan: Resource and supervision.
References
- Zhang Y, Yao B, Guo Y, Huang S, Liu J, Zhang Y, Liang C, Huang J, Tang Y, Wang Sorafenib reduces the production of epoxyeicosatrienoic acids and leads to cardiac injury by inhibiting CYP2J in rats. 2024; 223: 116169.
CrossRef - Widman, C. J., Ventresca, S., Dietrich, J., Elmslie, G., Smith, H., Kaup, G., & Messer, W. S. Hybrid Allosteric Modulators of M1 Muscarinic Receptors Enhance Acetylcholine Efficacy and Decrease Locomotor Activity and Turning Behaviors in Zebrafish. 2024.
CrossRef - Thangaraj, , Ramya Kuber, B., & Karthika, A. Development of an UPLC-QTOF-MS Method for the Simultaneous Estimation of Dronedarone and its Unlisted Pharmacopoeial Impurities. Journal of Analytical Chemistry. 2023; 78(7): 913-921.
CrossRef - Alsegiani, A. S., & Shah, Z. A. Development and validation of LC-MS/MS method for determining the metabolic stability, pharmacokinetics, and dose proportionality of a novel anti-inflammatory cofilin inhibitor. Journal of Pharmaceutical and Biomedical Analysis. 2023; 226: 115258.
CrossRef - Mishra, H., Behera, A., Kar, S. S., Dash, S., Moharana, S., & Sagadevan, S.Development and Optimization of Cefuroxime Axetil Nanosuspension for Improved Oral Bioavailability: In Vitro and In-Vivo Investigations. BioNanoScience. 2023; 13(4): 2371-2384.
CrossRef - Zhu, W., Liu, F., Hu, J., & Gu, Z. C. Shu-Juan Zhao, Bo-Ya Chen, Xue-Jiao Hong, Yin-Ping Liu, Hai-Xia Cai, Song Du, Zhi-Chun Gu and Pei-Zhi Effects of oral anticoagulant therapy in atrial fibrillation patients with comorbidities. 2023; 18: 63.
CrossRef - Parvin, R. R., Mohapatra, J., Sahu, R., Panigrahi, D., & Mishra, A. Development and validation of a stability-indicating assay method for determination of metronidazole benzoate in bulk: Spectroscopic approach. GSC Biological and Pharmaceutical Sciences. 2023; 24(2): 040-050.
CrossRef - Teaima, H., Alsofany, J. M., & El-Nabarawi, M. A. Clove oil endorsed transdermal flux of dronedarone hydrochloride loaded bilosomal nanogel: Factorial design, in vitro evaluation and ex vivo permeation. AAPS PharmSciTech. 2022; 23(6): 182.
CrossRef - Chimakurthy, J. Quantification of an Anti-Rheumatic Agent: Upadacitinib in Biological Fluid (Plasma) By LC-MS/MS. journal of pharmaceutical negative results. 2022; 3279-
CrossRef - Zhao, L., Yang, Q., Tang, , You, Q., & Guo, X. Design, synthesis, and biological evaluation of arylmethylpiperidines as Kv1. 5 potassium channel inhibitors. Journal of Enzyme Inhibition and Medicinal Chemistry. 2022; 37(1): 462-471.
CrossRef - Rohr, S., Foerster, K. I., Blank, A., Burhenne, J., Mahmoudi, M., Haefeli, W. E., & Mikus, Perpetrator characteristics of azole antifungal drugs on three oral factor Xa inhibitors administered as a microdosed cocktail. Clinical Pharmacokinetics. 2022; 1-13.
- Wang, Z., & Chan, E. C. Y. Inhibition of cytochrome P450 2J2-mediated metabolism of rivaroxaban and arachidonic acid by ibrutinib and osimertinib. Drug Metabolism and Disposition. 2022; 50(10): 1332-1341.
CrossRef - Denisov, G., Grinkova, Y. V., McLean, M. A., Camp, T., & Sligar, S. G. Midazolam as a probe for heterotropic drug-drug interactions mediated by CYP3A4. Biomolecules. 2022; 12(6): 853.
CrossRef - Renon, F., Rago, A., Liccardo, B., Andrea, A., Riegler, L., Golino, P.,& Russo, V. Direct oral anticoagulants plasma levels measurement: clinical usefulness from trials and real world data. In Seminars in Thrombosis and 2021 March; Vol. 47, No.02:150-160.
CrossRef - Conserva, G. A., Costa-Silva, T. A., Quirós-Guerrero, L. M., Marcourt, L., Wolfender, J.L., Queiroz, E. F., Lago, J. H. Kaempferol-3-O-α-(3, 4-di-Epcoumaroyl)-rhamnopyranoside from Nectandra oppositifolia releases Ca2+ from intracellular pools of Trypanosoma cruzi affecting the bioenergetics system. Chemico-Biological Interactions. 2021; 349: 109661.
CrossRef - Villanueva-Paz, M., Morán, L., López-Alcántara, N., Freixo, C., Andrade, R. J., Lucena, M. I., & Cubero, F. J. Oxidative stress in drug-induced liver injury (DILI): from mechanisms to biomarkers for use in clinical practice. Antioxidants. 2021; 10(3): 390.
CrossRef - Pang, H., Jiang, Y., Li, J., Wang, Y., Nie, M., Xiao, N., Hu, Z. Aberrant NAD+ metabolism underlies Zika virus–induced Nature Metabolism. 2021; 3(8): 1109-1124.
CrossRef - Wahab, A., Patnaik, R., & Gurjar, M. Use of direct oral anticoagulants in ICU patients. Part I–Applied pharmacology. Anaesthesiology Intensive Therapy. 2021; 53(5): 429-439.
CrossRef - Kumar, S. A., & Bhaskar, B. L. Development and validation of two spectrophotometric methods for the estimation of Dronedarone impurity molecule:(5-Amino-2-butyl-3 benzofuranyl)[4-[3-(dibutylamino) propoxy] phenyl] methanone. Materials Today: Proceedings. 2021; 46: 2940-2944.
CrossRef - Innov J. validation of simultaneous estimation of ranolazine and metformin HCl: A statistical 2020; 9: 50-7.

This work is licensed under a Creative Commons Attribution 4.0 International License.


