

How to Cite | Publication History | PlumX Article Matrix
Sathiyapriya Jagadeesan and Praveena Marannan*
Department of Computer Science, Dr.SNS Rajalakshmi College of Arts and Science, Coimbatore, Tamilnadu, India
Corresponding Author E-mail:praveenamarannan@gmail.com
ABSTRACT: Polycystic ovarian syndrome (PCOS), the most prevalent endocrine abnormality in women who are fertile, interferes with hormone secretion over time, leading to a large number of ovarian cysts and other serious health problems. However, the doctor's experience plays a significant role in the accuracy of interpretations, which makes the practical clinical diagnostic approach for PCOS essential. Therefore, a PCOS prediction model powered by artificial intelligence might be a workable supplement to the labor-intensive and prone to error diagnosis technique. This research proposes a novel technique in clinical data-based PCOS detection by dimensionality reduction with segmentation using a deep learning model. Here the input PCOS clinical data has been collected and processed for removing missing values and dimensionality reduction based on vector conversion with Kernel Principal Component Analysis. Then the data quality is enhanced with annotation coverage for PCOS detection using a dynamic Bayesian hidden Markov v model. The experimental analysis is performed for the PCOS clinical dataset in terms of prediction accuracy, validation accuracy, RMSE, precision, and F-1 score. The proposed method obtained an overall 97% F-1 score and prediction accuracy of 98%, validation accuracy of 98%, RMSE of 1%, and precision of 99%.
KEYWORDS: Artificial Intelligence; Deep Learning; Dimensionality Reduction; PCOS detection; Segmentation; Vector conversion
| Copy the following to cite this article: Jagadeesan S, Marannan P. Vector Conversion Based PCOS Detection in data segmentation using Multi Task Learning by Dynamic Deep Learning Architecture. Biotech Res Asia 2025;22(1). |
| Copy the following to cite this URL: Jagadeesan S, Marannan P. Vector Conversion Based PCOS Detection in data segmentation using Multi Task Learning by Dynamic Deep Learning Architecture. Biotech Res Asia 2025;22(1). Available from: https://bit.ly/4k6lLeU |
Introduction
Girls and women of reproductive age are more susceptible for a medical disorder referred to as polycystic ovarian syndrome (PCOS), which presents with a range of signs. Changes in menstrual cycle, abnormal face and body hair development, acne, obesity, the existence of ovarian cysts, and infertility are a few of these signs. It is a complicated, incurable disorder caused by a hormonal imbalance that typically has an impact on how the ovaries function. Future development of various health issues such as type 2 diabetes, gestational diabetes, high cholesterol, high blood pressure, sleep apnea, and stroke is quite likely in women with PCOS. According to studies 1, 3–10% of people in an undefined population have PCOS.2 PCOS and endometriosis are the two reproductive illnesses that affect women the most frequently. PCOS is characterized by polycystic ovaries, hyperandrogenism, and ovulatory dysfunction. In conjunction with other syndrome symptoms, hyper androgenism is acknowledged as a critical diagnostic factor (1). Different diagnostic methods are used in different parts of the world. National Institutes of Health (NIH) states that the presence of both hyperandrogenism and olgio/amenorrhea can be used to diagnose PCOS (2). Depending on diagnostic standards, PCOS incidence varies.3 About 7% of reproductive-aged women have hyper androgenic chronic an ovulation. One polycystic ovary is adequateto make diagnosis of PCOS according to Rotterdam criteria (3), which stipulate that the polycystic ovary must be ultrasonically visible. The prevalence of PCOS increases from 55% to 91% in women with norm gonadotropic an ovulation when using the NIH criteria (5). Secondary causes should be ruled out before primary causes, according to all diagnostic strategies. Machine learning (ML) techniques for PCOS identification have promise.4 Using image data, a ML method applied to ovarian ultrasound scans could accurately diagnose PCOS (6). Although the usage of intelligent programmes in medicine and healthcare is growing, a strong and focused strategy is still required. Targeting patients or medical professionals has demonstrated enormous potential for machine learning.5 Convolutional neural networks (CNN) and recurrent neural networks (RNN), which are used in machine learning techniques such as DL, the diagnosis can be made more accurately while the system can be made simpler. With the aid of annotated training data, these techniques can be widely utilised to model or simulate an intelligent system or process.6
Related Works
Deep learning algorithms like CNNs and RNNs have been used extensively in research to identify PCOS. An expert system using an artificial neural network7 was built to categorise PCOS cases using a dataset of 1000 samples divided into two groups: healthy individuals and subjects with diseases. For instance, author 8 distinguished between PCOS as well as non-PCOS criteria using Adaptive Boosting (AdaBoost), Bagging Ensemble with Random Forest, and Multi-Layer Perceptron (MLP) classification methods. An improved chi-squared (CS-PCOS) strategy9 for feature selection is presented for PCOS detection. Another study in this sector used the Chi-square approach to choose top 30 features from data10, and utilizing this condensed feature vector, RF, SVM, Logistic Regression, Gaussian Naive Bayes, and K Neighbours were utilized to predict the underlying condition of PCOS. Additionally, the diagnostic model that11 suggested using MATLAB to identify PCOS included seven many types of classifiers, and results revealed that Linear Discriminant classifier performed the best. In a different study, suggested by12, a sample of follicular fluid from 100 women was taken, resulting data set was pre-process reutilizing Raman spectra as well as efficient feature selection methods to be used for ML classification. RF, MLP, boosting algorithm, classification and regression tree methods were used to identify PCOS. An artificial neural network (ANN) 13 method for detecting PCOS early on after conducting a performance comparison analysis utilizing various NN optimizers to investigate best performing ANN model for classifying dataset into 2 categories: PCOS and Non-PCOS. Another related piece of research in this area was done by14, who looked at four different ML classifiers to categorise PCOS and non-PCOS records, compared their performance, and found that RF classifier outperformed others. Using RF classifier, DT was then created to determine main factors causing PCOS. To categorise PCOS patients based on scleral images, a DL method using U-net, ResNet 18, Multi Instance Learning design15 was proposed to improve accuracy. In total, the items in their possession included 721 images, 388 of them included people with PCOS. Their suggested method achieved an average AUC of 98% and accuracy of 93%. A CAD model16 is developed a method to identify PCOS in ultrasound images using image segmentation and convolutional neural network (CNN). The K-Nearest Neighbour algorithm was also used to categorise the images. Using their own dataset17 it is fine-tuned 16 Layered VGG-16 methods to categorise PCOS from ultrasound images. Their model had a 92.11% accuracy rate. Image binarization was used by18 on ultrasound B-mode pictures. Image binarization19,20 was used as an image pre-processing technique to convert ultrasonic images of ovarian cysts to grey scale images. The post-processing which includes labeling and connecting of various portions in PCOS, produced the extraction of geometrical features as well as the classification of cysts has been discussed. 90% accuracy is achieved using SVM as the classifier. Some of the additional deep learning techniques were utilized for improvisation of accuracy and boosting data optimization.21,22
Materials and Methods
The following subsection discusses a new hybrid approach for vector conversion-based PCOS detection utilizing deep learning techniques by dimensionality reduction and segmentation. Here to collect input PCOS data and processed for noise removal with vector conversion. Dynamic Bayesian hidden Markov-v-model is employed to improve the quality and coverage of the PCOS image annotations. The data dimensionality reduction is carried out using kernel principal component analysis (KPCA). The proposed architecture for PCOS detection is exhibited in Figure 1.
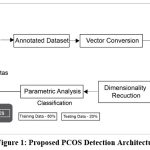 |
Figure 1: Proposed PCOS Detection Architecture |
After completing image collection, the process for obtaining clinical data was begun to investigate how clinical data affected the diagnosis of PCOS. This procedure seeks to obtain clinical data for patients whose ultrasound images were gathered in the previous phase from the hospital system. The features were chosen with the assistance of professional judgments and with consideration of previous studies that identified the significance of those attributes on PCOS diagnosis in some manner.11,22 There are many clinical data points that are lacking and need further validation, as we discovered while collecting clinical data for 391 patients whose ultrasound photos were already accessible. Ultimately, a dataset has 285 samples and 22 characteristics. The clinical dataset is composed of 156 non-PCOS individuals and 129 PCOS cases. Diagnoses for patients in the dataset are made using laboratory results, medical records, and radiologist analysis of ultrasound pictures to distinguish between PCOS and non-PCOS. Characteristics are divided into four categories, including demographics, vital signs, lab results, and doctors’ comments, such as cycle regularity. The dataset has two data types, four nominal/categorical features, and 17 numeric features. Additionally, only photos that clearly show the ovary were chosen for the investigation. Radiologists divided the selected images into two categories for categorization: the sonographically visible PCOM and those with a normal morphology (non-PCOM). As seen in Figure 2, PCOM is represented by an ovary with several, uniformly sized, peripherally positioned follicles that are smaller than one centimetre. The dataset of photographs consists of 391 images which has clinical record result of 127 PCOM, and 264 normal ovaries that are not PCOM.
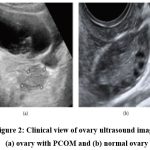 |
Figure 2: Clinical view of ovary ultrasound image: (a) ovary with PCOM and (b) normal ovary |
Four categories can be used to group the characteristics, including demographics, vital signs, laboratory tests, and medical notes. The dataset has two data types, four nominal/categorical features, and 17 numeric features. Additionally, only photos that clearly show the ovary were chosen for the investigation. Radiologists divided the selected images into two categories for categorization: those with a non-PCOM and those displaying the sonographic PCOM. Figure 2 illustrates an ovary with numerous, uniformly sized follicles that are positioned peripherally and have a diameter of less than 1 cm. This is the definition of the polycystic ovarian morphology. 391 pictures, 127 PCOM, and 264 normal ovaries that are not PCOM make up the image dataset.
Kernel Principal Component Analysis Based Dimensionality Reduction
A variety of techniques may be used as part of the dimensionality reduction pre-processing techniques. The following advantages that the DR offers are taken into consideration:
As the number of dimensions rises, the amount of memory that can be used to store data gets smaller.
Reducing the number of dimensions requires shorter training or computation times.
Most feature extraction techniques struggle to handle many-dimensional data.
Multi-collinearity between various data features is successfully handled using DR techniques, and redundant features are removed.
Reduced data dimensions also facilitate visualization.
The PCA changes the attributes in a dataset into new functions referred to as primary components. The crucial element is a linear combination of the starting variables of the dataset. Primary elements are arranged in a way that the first primary element indicates the greatest discrepancy in the outcomes. However, there is no correlation between them and the first main data variable. Singular Value Decomposition (SVD) splits the original matrix into its component pieces, which are then used to find redundant features. SVD is based on the concepts of eigenvalues and eigenvectors. The main head variable is discussed in a way that demonstrates the greatest possible variation. The numerical concept of PCA is as follows: A given information focal with t = 1, 2,…, and , usually , so that x is , such that x is n p input grid. PCA resolves the conceded Eigen esteems issue by converting this vector space into new vectors.
![]()
c = (1/p (∑t=1p c xt xtT)), and μis Eigenvector whose corresponding to Eigen value λi;
![]()
Primary yt(i) variable with highest Eigen value corresponds to data set’s largest variance vector. The first few Eigenvectors are only used when the initial vector space PCs are organized in decreasing order by their corresponding Eigen values. Only then can the initial vector space PCs be transformed into new PC vectors, k < n.
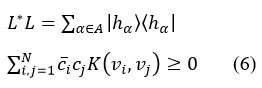
The Hilbert space H is utilized to implement the self-adjoin operator for the trace class G eqn (3).
![]()
Let (ha)a€A be a frame in H. Set L : H → l by eqn (4)
![]()
Then L*:l2→H represented byeqn (5),
![]()
where(cα )∈l2; and by eqn (6)
for all ∣ {xi}(i=1)N ⊂ S, {ci} (i=1) N ∣ ⊂ C, and N ∈ N.
![]()
Additionally, replicating characteristic that follows is true by eqn (8):
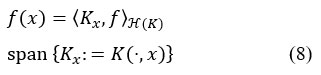
H (K)-inner product by eqn (9)
Since each patient may experience a unique set of symptoms or combinations of symptoms, the most significant features may be what determines the diagnosis. Therefore, feature selection methods might be extremely important in order to choose the most effective features and lower the dataset’s dimension to aid doctors in the diagnosis process.
Dynamic Bayesian Hidden Markov Model
It is defined by the HMM model’s transition probability, emission probability, and prior distribution. Our model presupposes that each topic ‘t’ and each authors ‘a’ are connected by multinomial distributions ‘t’ over words and ‘a’ over topics, respectively. More specifically, two matrices, the TA matrix of author-topic distributions and the WT matrix of topic-word distributions, provide the parameters by eqn (10).
![]()
and for t, similarly. Assuming that A is corpus’s set of authors and that document d has authors from A, it is clear that, under these presumptions, a document’s likelihood is given by:
![]()
Which can be combined across the variable j and q and their respective Dirichlet distributions to obtain P(d|a, β, A). Markov chain Monte Carlo Methods can be used to efficiently sample the posterior and MAP or MPE methods, for example can be used to estimate Θ and Φ specification matrices. A repository R that stores evolution of a group of NF files serves as the main component of an SCM system by eqn (11):
![]()
Each file Fi is kept as a collection of NVi versions in a repository by eqn (12):
![]()
Every version is a tuple with several attributes. The most common ones are a unique version ID, the committer’s name, the commit time, a log message, and its contents by eqn (13):
![]()
In the following, we shall eliminate the file index I when referring to a single file in order to simplify the notation. The properties message, time, author, and id are unstructured. Eqn (14) models the content using a collection of entities:
![]()
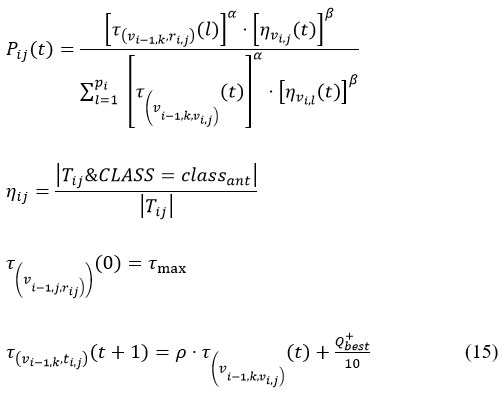
Convergence is achieved when a path’s edges all have pheromone levels of s-max and all other edges have pheromone levels of s-min. Following that, a rule matching the path with s-max is retrieved and added to the rule set. Ultimately, training data in the training set that satisfies this criterion is removed. until an early stopping requirement is met, repeat this procedure iterativelyby eqn (15).
Suppose that we are trying to use eqn (16) to find the expected value of a random variable X.
![]()
To a certain g-function. If functions f, g is such that it is not possible to evaluate the integral in (1) directly, then the following can be done. Assuming we can draw a sample from the distribution of X, produce a random sample of size n by eqn (17):
![]()
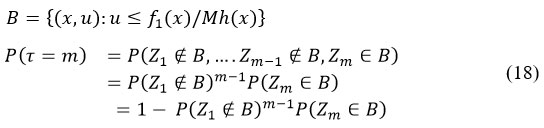
Given a uniform (0,1) Uk and an i.i.d. the variable Xk with a common frequency h. Let B come from by eqn (18).
and hence P ( t < ∞) = 1, Now
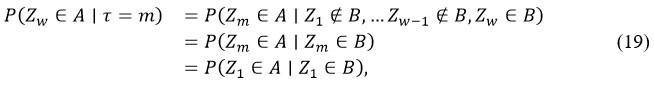
hence
taking A = (-∞, a] × [0,1] for a ∈ R, we have (using {ZT ∈ A} = {W ≤ a}),
For all variables X1…N, the likelihood function of HMDBN has the following structure by eqn (22):
![]()
It is assumed that the transition between hidden graphs follows the first order Markov chain. Additionally, it is assumed that the present observation is statistically independent of the preceding observations, according to the formula P(x(1: T) ∣ q(1:T)) = ∏(t=1)T P(x(t) ∣ q (t)). Consequently, it is simple to demonstrate that
![]()
Furthermore, we presumptively consider that concealed state qi for parameter Xi is statistically distinct from that of remaining variables. Concealed graph, which is also a DBN, adheres to conditional independence presumption. Consequently, above formula is by eqn (24)
As a result, we broke down the probability function for each variable into a series of terms, where every term is solely dependent on parents chosen for that variable as well as any pertinent node-specific characteristics. This allows for a modular evaluation of all local adjustments to a possible non-stationary network. A sub-network in HMDBNi is represented by a graph in each rectangle that only designs conditional relationships between the variable Xi and its parents Gi. The figures enclosed in parenthesisindicate duration. Observable states are represented by the darkened nodes. There is an observable state associated with each hidden graph. The time-points at which regulatory inputs to variables change are referred to as transition times for one variable. Because each non-stationary sub-network HMDBNi might have a variable transition time and hidden graph, the HMDBN is node-specific.
Consequently, we use SEM algorithm23. It combines structural search for model selection with the conventional EM technique, which optimises parameters. BWBIC rating. This is how Q function is expressed by eqn (25):
By solving with regard to and A, first two terms in parenthesis of Eq. (26) is maximised. Next, we can obtain their updated estimates:
After getting marginal likelihood for each hidden graph Gi h, we may solve following optimisation issue to yield G ′ i h, which optimises the third term by eqn (27).
![]()
A local maximum is still guaranteed to be reached by this generalised EM method. We used the Laplace approximation, a large-sample approximation method, to derive an efficient way to approximate this integral. As a result, the following formula comes close to expressing logarithmic marginal likelihood in formula (28):
where
Finding a female patient with PCOS requires a significant amount of time and work. The research work that has been provided thus suggests automating the implementation of disease diagnosis in order to further support it through manual evaluation by medical professionals and experts. This would make it easier to detect the illness at the proper time and stop it from developing in later stages, enabling the treatment of ovarian disorders. Through a dataset that is given to the system, the implemented approach often predicts the presence of the disease.
Results of the Proposed Work
The experimental findings are presented and discussed in this section. The ML models were created using Scikit-learn. The trials were carried out using Google Colab. Additionally, other ML methods based on various feature selection techniques were compared to the stacking ML models. Two training and testing sets with ratios of 20:80 and 30:70 are used to track the models’ performance.
Description of Set
The individuals who went to the Ghosh Dastidar. Establishment for Ripeness Exploration (GDIFR), located in Kolkata, between April 2010 and Walk 2010, were the focus of the review.The clinic provided a pre-made form for each patient to use in order to record their medical history and any additional physical exams.Of the 250 women that were remembered for this study, 150 had polycystic ovary disease (PCO), while the remaining 100 had normal ovarian function.The PCOS symptomatic criteria were developed by the American Society for Regenerative Medicine (ASRM) and the European Society for Human Reproduction and Embryology (ESHRE).The following three conditions must be met: oligo- and anovulation, polycysts in at least one ovary, and an ultrasound exam showing a clinical and/or biochemical evidence of increased male hormone production. PCO should be confirmed if the patient satisfies any two of the ASRM/ESHRE-recommended requirements. The following criteria were used to diagnose PCOS: 1) The length of the cycle; 2) the clinical and metabolic characteristic; and 3) polycystic ovaries, with hyperthyroidism and Cushing syndrome excluded. Patients who were either virgin or refused treatment, as well as those whose ovaries did not contain a follicle, were not included in the analysis. Exploring best subsets of features to ensure best possible data description is the process. In this review, dataset contains 40 credits subsequent to pre-processing, which might bring down exactness of classifier on off chance that the less critical ones are all considered. Accordingly, the elements in this setting have been focused on and chosen thoroughly utilizing three kinds of component determination methods to figure out the ideal arrangement of highlights from the PCOS informational index.
Dataset Link
https://www.kaggle.com/datasets/ayamoheddine/pcos-dataset
http://biogps.org/dataset/tag/pcos/
https://www.kaggle.com/datasets/prasoonkottarathil/polycystic-ovary-syndrome-pcos
Discussions
Table 1: Proposed analysis based on various PCOS text dataset
| Dataset | Prediction Accuracy | Validation Accuracy | Root Mean Squared Error | Precision | F1-Score |
| Data 1 | 97 | 97 | 2 | 96 | 96 |
| Data 2 | 96 | 95 | 4 | 96 | 93 |
| Data 3 | 98 | 98 | 1 | 99 | 97 |
The aforementioned table-1 presents a suggested analysis based on multiple PCOS text datasets in terms of F-1 score, RMSE, precision, and prediction and validation accuracy. We investigate and compare various fusion algorithms to merge image characteristics with clinical features in order to determine whether fusion of image and clinical features can affect PCOS prediction. Joint fusion and late have been contrasted in the beginning. Due to the fact that all cases have been determined to be negative, the late fusion does not produce any hopeful results. Figure 3 portrays the proposed analysis based on various PCOS data for all performance metrics.
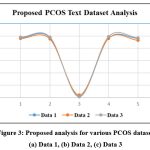 |
Figure 3: Proposed analysis for various PCOS dataset (a) Data 1, (b) Data 2, (c) Data 3 |
The estimations of the true positive rate and false positive rate serve as the foundation for the analysis. The second experiment looks at how clinical characteristics affect ultrasound image-based PCOS diagnosis. The ultrasound picture features are combined with clinical information in a fusion deep learning model to obtain a conclusive diagnosis of PCOS. The suggested method is trained by minimising loss of a “objective” function against dataset with the goal of minimising the error, and the selection of the loss function is a key hyperparameter for achieving the desired results. The suggested confusion matrix for several PCOS text datasets is projected in Figure 4.
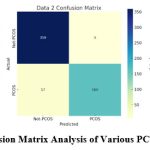 |
Figure 4: Confusion Matrix Analysis of Various PCOS Datasets |
Table 2: Proposed Analysis for PCOS Dataset
| Dataset | Techniques | Prediction Accuracy |
Validation Accuracy |
RMSE | Precision | F1-Score |
| Data 1 | Reinforcement_PSO | 85 | 88 | 45 | 83 | 78 |
| SVM_ICA | 88 | 89 | 46 | 86 | 80 | |
| DBMM_KPCA [Proposed] |
97 | 97 | 2 | 96 | 96 | |
| Data 2 | Reinforcement_PSO | 92 | 86 | 57 | 84 | 85 |
| SVM_ICA | 94 | 94 | 58 | 89 | 89 | |
| DBMM_KPCA [Proposed] |
96 | 95 | 4 | 96 | 93 | |
| Data 3 | Reinforcement_PSO | 88 | 91 | 59 | 87 | 84 |
| SVM_ICA | 94 | 95 | 60 | 90 | 87 | |
| DBMM_KPCA [Proposed] |
98 | 98 | 1 | 99 | 97 |
Using logical transformations like erosion, dilation, and others, the process of feature extraction uses comparisons based on different PCOS text datasets in terms of Prediction accuracy, Validation accuracy, RMSE, Precision, and F-1 score. These adjustments are straightforward image-dependent actions. Typically, these processes are carried out on a grayscale image. The limits of the foreground are destroyed by the erosion process. With the kernel, it does a 2D convolution. If each pixel is below the kernel value of 1, as in a characteristic pixel image (original image), it erodes differently. As a result, the front body’s thickness is minimal. The process of dilation is the exact opposite of erosion. While narrowing the object, erosion narrows the white noises. The surface of the item increases when the noise is reduced. Therefore, dilatation undoes the lost area of the item caused by erosion. Therefore, dilation typically occurs after the erosion process.
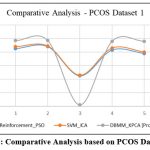 |
Figure 5: Comparative Analysis based on PCOS Dataset – 1 |
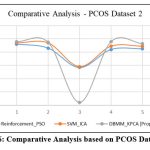 |
Figure 6: Comparative Analysis based on PCOS Dataset – 2 |
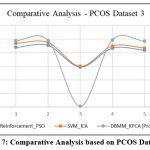 |
Figure 7: Comparative Analysis based on PCOS Dataset – 3 |
From above Figure 5, 6 and 7, the comparison is shown for various PCOS dataset. Here proposed technique Prediction accuracy of 97%, validation accuracy of 97%, RMSE of 2%, precision of 96%, F-1 score of 96%; existing Reinforcement_PSO attained Prediction accuracy of 85%, validation accuracy of 88%, RMSE of 45%, precision of 83%, F-1 score of 78%, SVM_ICA attained Prediction accuracy of 88%, validation accuracy of 89%, RMSE of 46%, precision of 86%, F-1 score of 80% for dataset 1; for dataset 2 proposed technique Prediction accuracy of 96%, validation accuracy of 95%, RMSE of 4%, precision of 96%, F-1 score of 93%; existing Reinforcement_PSO attained Prediction accuracy of 92%, validation accuracy of 86%, RMSE of 57%, precision of 84%, F-1 score of 85%, SVM_ICA attained Prediction accuracy of 94%, validation accuracy of 94%, RMSE of 58%, precision of 89%, F-1 score of 89%; proposed technique Prediction accuracy of 98%, validation accuracy of 98%, RMSE of 1%, precision of 99%, F-1 score of 97%; existing Reinforcement_PSO attained Prediction accuracy of 88%, validation accuracy of 91%, RMSE of 59%, precision of 87%, F-1 score of 84%, SVM_ICA attained Prediction accuracy of 94%, validation accuracy of 95%, RMSE of 60%, precision of 90%, F-1 score of 87% for dataset 3.
It can be shown that among the different classifiers for CV 20, voting 1 (soft) offers the highest accuracy. There is a lot of literature on PCOS, however not all of the datasets are comparable. Direct comparison is therefore not possible.
A 70:30 train-to-test split ratio and an 80:20 split ratio were the two sets of frameworks that were created. This would aid us in analysing the top-performing framework in the next steps. Feature scaling came after the separation. We used the common scalar approach to scale the features in the training dataset. After standardisation, the data is unaffected by outliers and has no bounding range. Only 177 out of 541 samples in the target PCOS (Y/N) class had PCOS, creating an imbalance. We balanced the data on the training dataset using the Borderline Synthetic Minority Oversampling Technique (SMOTE) to lessen the risk of improper model training. This technique creates fake data points from minority classes by oversampling. In contrast to conventional SMOTE, it addresses problem of incorrectly categorised outliers. We acquired 364 and 364 counts for both PCOS and Non-PCOS classes following Borderline-SMOTE balancing.
Model Analysis with Decision Tree Visualization
The proposed PCOS detection model leverages Kernel Principal Component Analysis (KPCA) for dimensionality reduction and a Dynamic Bayesian Hidden Markov Model (DBHMM) for segmentation and classification. To illustrate its classification process, a decision tree model is used to visualize feature-based decision points, reflecting how key features like hormonal levels, BMI, and menstrual irregularities influence PCOS prediction.
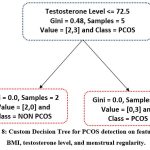 |
Figure 8: Custom Decision Tree for PCOS detection on features like BMI, testosterone level, and menstrual regularity. |
Advantages of the Proposed Methodology
High Accuracy and Precision: The model achieves 98% accuracy, demonstrating its reliability in diagnosing PCOS.
Robust Data Processing: KPCA effectively reduces data dimensions, mitigating overfitting risks.
Temporal Feature Integration: DBHMM accounts for time-dependent changes, enhancing clinical relevance.
Interpretability: The decision tree visualization aids in understanding critical diagnostic features.
Disadvantages of the Proposed Methodology
Computational Complexity: Combining KPCA and DBHMM requires significant computational power.
Data Dependency: The model’s performance is highly dependent on dataset quality and size.
Limited Real-World Deployment: Real-time PCOS detection may face delays due to processing complexity.
Future Work
Future efforts should focus on integrating ensemble techniques like Random Forest or Gradient Boosting to enhance robustness and accuracy. Furthermore, employing larger, diverse datasets and exploring multi-modal learning combining clinical and imaging features can improve real-world application potential. Additionally, incorporating explainable AI (XAI) tools can ensure trustworthiness in critical healthcare systems.
Conclusion
This research work suggests a novel technique in dimensionality reduction with segmentation of text analysis in PCOS detection using deep learning techniques. Here the input text PCOS clinical data is pre-processed and segmented using Kernel Principal Component Analysis and Dynamic Bayesian Hidden Markov Model. To develop a PCOS diagnosis as well as an analysis method for CAD systems is the goal of this research project. One dataset contains images of the ovaries taken using ultrasound technology, while the other contains clinical data such as vital sign data, lab test results, and other symptoms that can be used to diagnose PCOS. It is suggested to use a variety of DL methods to implement AI-based CAD. In order to lower the false positive rate as well as improve the performance of the proposed method, the first proposed model uses ovary ultrasound images to detect PCOS morphology using a deep learning model for automated PCOM diagnosis. Using a DL method to detect PCOS, this research activity has published a study to examine the effects of merging imaging as well as clinical information. The proposed method achieved an F-1 score of 97% and prediction accuracy of 98%, validation accuracy of 98%, RMSE of 1%, and precision of 99%.
Acknowledgement
I, Sathiyapriya Jagadeesan would like to express my sincere gratitude to Praveena Marannan, my research supervisor and the research institution, Dr SNS Rajalakshmi College of Arts & Science, Coimbatore, Tamil Nadu for the support and research facility provided throughout this research work.
Funding Sources
The author(s) received no financial support for the research, authorship, and/or publication of this article.
Conflict of Interest
The authors do not have any conflict of interest.
Data Availability Statement
This statement does not apply to this article.
Ethics Statement
This research did not involve human participants, animal subjects, or any material that requires ethical approval.
Informed Consent Statement
This study did not involve human participants, and therefore, informed consent was not required.
Clinical Trial Registration
This research does not involve any clinical trials.
Author Contributions
Sathiyapriya Jagadeesan: Collected the PCOS text data and initiate the research work and implemented in the application for proposed model and guided the analysis of the PCOS dataset.
Praveena Marannan: Played a key role in refining the manuscript as a corresponding author and provided crucial insights for interpreting the results in simulator tool.
References
- Kumari R, Singh J, Gosain A. SmS: SMOTE-stacked hybrid model for diagnosis of polycystic ovary syndrome using feature selection method. Expert Systems With Applications. 2023;225:120102.
CrossRef - Alamoudi, A., Khan, I. U., Aslam, N., Alqahtani, N., Alsaif, H. S., Al Dandan, O., & Al Bahrani, R. A Deep Learning Fusion Approach to Diagnosis the Polycystic Ovary Syndrome (PCOS). Applied Computational Intelligence and Soft Computing. 2023; 2023:1-15.
CrossRef - Elmannai, H., El-Rashidy, N., Mashal, I., Alohali, M. A., Farag, S., El-Sappagh, S., & Saleh, H. Polycystic Ovary Syndrome Detection Machine Learning Model Based on Optimized Feature Selection and Explainable Artificial Intelligence. Diagnostics. 2023;13(8):1506.
CrossRef - Chitra P, Srilatha K, Sumathi M, Jayasudha FV, Bernatin T, Jagadeesh M. Classification of Ultrasound PCOS Image using Deep Learning based Hybrid Models. 2023 Second IEEE International Conference on Electronics and Renewable Systems (ICEARS). 2023.
CrossRef - Khanna VV, Chadaga K, Sampathila N, Prabhu S, Bhandage V, Hegde GK. A Distinctive Explainable Machine Learning Framework for Detection of Polycystic Ovary Syndrome. Applied System Innovation. 2023;6(2):32.
CrossRef - Nithyanandh S, Omprakash S, Megala D, Karthikeyan MP. Energy Aware Adaptive Sleep Scheduling and Secured Data Transmission Protocol to enhance QoS in IoT Networks using Improvised Firefly Bio-Inspired Algorithm (EAP-IFBA). Indian Journal of Science and Technology. 2023;16(34):2753-2766.
CrossRef - Arularasan R, Balaji D, Garugu S, Jallepalli VR, Nithyanandh S, Singaram G. Enhancing Sign Language Recognition for Hearing-Impaired Individuals Using Deep Learning. IEEE International Conference on Data Science and Network Security (ICDSNS). 2024:1-6.
CrossRef - Lv, W., Song, Y., Fu, R., Lin, X., Su, Y., Jin, X., & Huang, G. Deep Learning Algorithm for Automated Detection of Polycystic Ovary Syndrome Using Scleral Images. Frontiers in Endocrinology. 2022;12.
CrossRef - Gupta A, Fatima H. A Systematic Review of Machine Learning for Ovarian Cyst Detection using Ultrasound Images. 2023 2nd IEEE International Conference on Applied Artificial Intelligence and Computing (ICAAIC). May 2023.
CrossRef - Mittapalli JS, Khanna K, Mutha JA, Nair S. A Cloud-Based Prediction and Self-Diagnosis System for PCOS Using Machine Learning Models. In: Lecture Notes in Electrical Engineering. ; 2023:477-484.
CrossRef - Selvam N, Joy J. K. Plant Leaf Disease Detection with Multivariable Feature Selection Using Deep Learning AEN and Mask R-CNN in PLANT-DOC Data. Biotech Res Asia 2024;21(4), 1649-1663.
CrossRef - Swamy SR, S NPK. Hybrid Machine Learning Model for Early Discovery and Prediction of Polycystic Ovary Syndrome. 2022 Second IEEE International Conference on Advanced Technologies in Intelligent Control, Environment, Computing & Communication Engineering (ICATIECE). 2022; 9:1-8.
CrossRef - Kharb S, Joshi A. Multi-omics and machine learning for the prevention and management of female reproductive health. Frontiers in Endocrinology. 2023;14.
CrossRef - R S, R NB, Radhakrishnan R, P S. Computerized Diagnosis of Polycystic Ovary Syndrome Using Machine Learning and Swarm Intelligence Techniques. Research Square (Research Square). January 2023.
- Vora K, Shah A, Shah N, Verma P. Prediction of Polycystic Ovary Syndrome (PCOS) Using Optimized Machine Learning Classifiers. In: Algorithms for Intelligent Systems. ; 2023:1-12.
CrossRef - Chen, W., Yang, Q., Hu, L., Wang, M., Yang, Z., Zeng, X., & Sun, Y. Shared diagnostic genes and potential mechanism between PCOS and recurrent implantation failure revealed by integrated transcriptomic analysis and machine learning. Frontiers in Immunology. 2023;14.
CrossRef - Harish KP, Dhivyanchali MN, Devi KN, Krishnamoorthy N, Sree RD, Dharanidharan R. Smart Diagnostic System For Early Detection And Prediction Of Polycystic Ovary Syndrome. Conference: 2023 IEEE International Conference on Computer Communication and Informatics (ICCCI). 2023;1:1-6.
CrossRef - Dutta P, Paul S, Sadhu A, Jana GG, Bhattacharjee P. Performance of Automated Machine Learning Based Neural Network Estimators for the Classification of PCOS. In: Intelligent Human Centered Computing. ; 2023:65-73.
CrossRef - Ambad R, Agrawal A, Lahoti R, Muley P, Pande P. Role of artificial intelligence in PCOS detection. Journal of Datta Meghe Institute of Medical Sciences University. 2022;17(2):491.
CrossRef - Faris NN, Miften FS. An intelligence model for detection of PCOS based on k‐means coupled with LS‐SVM. Concurrency and Computation Practice and Experience. 2022;34(21).
CrossRef - Devi PA, Megala D, Paviyasre N, Nithyanandh S. Robust AI Based Bio Inspired Protocol using GANs for Secure and Efficient Data Transmission in IoT to Minimize Data Loss. Indian Journal of Science and Technology. 2024;17(35):3609-3622.
CrossRef - Eldho KJ, Nithyanandh S. Lung Cancer Detection and Severity Analysis with a 3D Deep Learning CNN Model Using CT-DICOM Clinical Dataset. Indian Journal of Science and Technology. 2024;17(10):899-910.
CrossRef

This work is licensed under a Creative Commons Attribution 4.0 International License.


