How to Cite | Publication History | PlumX Article Matrix
UV and Two Derivative Spectrometric Methods for Determination of Racecadotril in Tablet Formulation
Ch.Narasimha Raju Bh1, G. Devala Rao2 and Ramanjaneyulu Sikharam3
1A.S.N Pharmacy College, Burripalem Road, Tenali - 522 201 India.
2KVSR Siddhartha College of Pharmaceutical Sciences, Vijayawada - 520 010 India.
3St. Ann’s College of Pharmacy, Chirala India.
ABSTRACT: UV, second and third derivative spectrophotometric methods have been developed for the determination of Racecadotril in pharmaceutical formulation. The solutions of standard and sample were prepared in Methanol. For the first method, UV spectrophotometry, the quantitative determination of the drug was carried at 23l nm and the linearity range was found to be 8-100ug/ml.For the second and third derivative spectrophotometric methods the drug was determined at 250nm and 240nm with linearity ranges for both 8-100ug/ml .The calibration graphs constructed at their wavelength of determination were found to be linear for UV and derivative spectrophotometric methods. All the proposed methods have been extensively validated. The described methods can be readily utilized for the analysis of pharmaceutical formulation.
KEYWORDS: UV spectophotometry; derivative spectrophotometry; Racecadotril
Download this article as:| Copy the following to cite this article: Raju Bh C.N, Rao G.D Sikharam.R. UV and Two Derivative Spectrometric Methods for Determination of Racecadotril in Tablet Formulation. Biosci Biotechnol Res Asia 2008;5(2). |
Introduction
Racecadotril is an effective and safe drug for acute diarrhea in adults and children.chemixcally racecadotril is N-[(R,S)-3-acetylmercapto-2-benzylpropanoyl]-glycine benzy}ester1. The drug controller General of India approved it as an antidiarrheal in October 2001.It is not yet official in any pharmacopoeia. A survey of literature survey reveals that a few HPLC and UV3,4,7 method were reported for the estimation of racecadotril in Pharmaceutical formulation and biological fluids2,5,6. In the present report the authors purpose a simple, sensitive and economical UV and two derivative spectrophotometric methods for the determination of Racecadotril in tablet formulation. The method is based on the measurement of light absorption in UV region in methanol.
Experimental
Pharmaceutical grade Racecadotril was a generous gift from Dr.Reddy’s laboratories pvt.Ltd (Hyderbad,India).All analytical grade chemicals were purchased from Merck(India).Racecadotrilsachets(sachectredotil.DR.Reddyslaboratoriespvt.Ltd:Hyd,India) containing l0mg of Racecadotril per sachet was assayed .A shimadzu UV/VIS 1601 Spectrophotometer with data processing system was used. UV and derivative spectra of the solution were recorded in 1 cm quartz cells at a scan speed of 2800nm/min, a scan range of 200 -400nm.for UV, 221-350nm for second and third derivative.
Preparation Of Standard Solutions
Stock standard solution was prepared by dissolving 10 mg of Racecadotril in 10 ml methanol. The standard solutions were prepared by dilution of the sock solution with methanol in a concentration range of 8-100 ug/ml for UV, 2nd and 3rd derivative spectrophotometric methods, respectively.
Market Sample Analysis
A total of 10 sachets of Racecadotril were accurately weighed and powdered. An amount of sachet equivalent to 100mg of Racecadotril was weighed and transferred in 100ml calibrated volumetric flask, containing about 60ml methanol. The contents were sonicated for 10-15 minutes with shaking to ensure the complete solubility of the drug and then volume made up with methonal.This solution was filtered to remove any insoluble matter. The filter ate was collected in a clean flask. Appropriate dilution were made to obtain with methanol from stock solution for UV and derivative spectrophotometric methods at 231,250 and 240 nm respectively.
Method Validation
Linearity 8
Under the experimental conditions described the graph obtained for UV, Second and third derivative spectra showed linear relationship(Fig 1,2,3). Regression analysis using the method of least squares was made for the slope, intercept and correlation co-efficient values. The regression equations of calibration curves were Y = 0.0093X +0.0014, (R=0.9998) for the UV,Y =0.0003x +0.0018, (R=0.9998) for the Second, Y = 0.0001X – 0.000018(R=1) for Three derivative spectrophotometric methods, respectively (Fig 1A,2A,3A). The range was found to be 8-100 ug/ml for UV, second and third derivative spectrophotometric methods .The statistical parameters given are the regression equation calculated from the calibration graphs, along with standard deviation of the slope and interest. The results are presented in table 1.
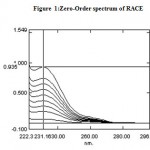 |
Figure 1: Zero-Order spectrum of RACE.
|
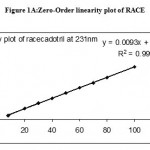 |
Figure 1A: Zero-Order linearity plot of RACE.
|
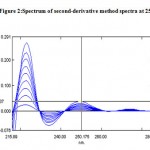 |
Figure 2: Spectrum of second-derivative method spectra at 250 nm.
|
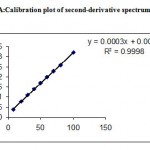 |
Figure 2A: Calibration plot of second-derivative spectrum at 250 nm.
|
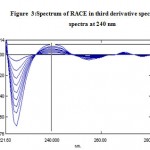 |
Figure 3:Spectrum of RACE in third derivative spectroscopy spectra at 240 nm.
|
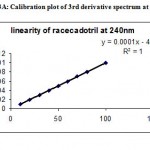 |
Figure 3A: Calibration plot of 3rd derivative spectrum at 240 nm.
|
Second and third derivative spectra of Racecadotril in standard and drug formulation solutions showed that the wavelength of maximum absorbance did not change. According to the result obtained by recovery study, the derivative spectrophotometric method is able to access the analyte in presence of excipients and hence, it can be considered specific limit of detection (LOD) and limit of Quantitation (LOQ) were determined by using the formula based on the standard deviation of response and the slope. The limit of detection (LOD) and limit of Quantification (LOQ) were calculated by using the equation LOD = 3X σ /s and LOQ = 10Xσ/S, .Where σ is the standard deviation of intercepts is the slope (Table 1).
Table 1: Statistical Data for calibration curves for Determination of Racecadotril
| Parameters | UV | Second
Derivative |
Third
Derivative |
| Absorption Maxima(nm) | 231 | 250 | 240 |
| Beer’s law limits(ug/ml) | 8-100 | 8-100 | 8-100 |
| Molar extinction co-efficient | 0.009275 | – | – |
| Sandal’s sensitivity | 0.0927921 | – | – |
| Regression equation(y) | 0.9998 | 0.9998 | 1 |
| Slope(b) | 0.0093 | 0.0003 | 0.0001 |
| Intercept(a) | 0.0014 | 0.0018 | 0.00018 |
| Co-efficient of variance | 0.9111 | – | – |
| Standard deviation | 0.00334 | 0.00953 | 0.00015 |
| LOD(ug/ml) | 0.8874 | 0.07874 | 0.04315 |
| LOQ(ug/ml) | 0.268938 | 0.19782 | 0.1262 |
Table 2: Results of analysis of REDOTIL Sachets.
| Statistical value | UV | Second derivative | Third derivative |
| X*
SD |
9.98
0.0033 |
9.96
0.0953 |
9.89
0.0673 |
X* mean of six readings, SD is the Standard Deviation .REDOTIL are sachets containing 10mg sof Racecadotril, n =6
Accuracy
To study the accuracy of the proposed methods and to check the interference from excipients used in the dosage forms, recovery experiments were carried out by the standard addition method. This study was performed by addition of known amounts of Racecadotril to preanalysed solution of commercial tablet .The mean recoveries were found to be 100.51±0.987, 100.38±0.0953,100.60±0.678 respectively for UV,second and third derivative spectroscopy.
Precision
To determine the precision of the method, Racecadotril solutions at a concentration of 8, 20,40,60,80 ug/ml were analyzed each in triplicate. Solutions for the standard curves were prepared fresh everyday. The methods were found to be precise .The % RSD values for intra day precision studies were found to be 0.82, 0.90 and 0.77 for UV,Second and Third derivative spectroscopy respectively.
For robustness and reggudness of analytical methods the tests mentioned below were carried out. The robustness of developed methods was tested by changing parameters such as degree of derivation, wavelength range and N value and the optimum parameters were chosen for this study .The UV and derivative spectrophotometric determinations of Racecadotris were carried out by two different analysts on the same standard. The results showed no statistical differences suggesting that the developed methods were robust and drugged (Table 2). The developed methods are accurate, sensitive and precise and can be easily applied to be pharmaceutical formulation
Acknowledgements
The authors gratefully acknowledge.Dr.Reddys laboratories limited (Hyd, India) for providing gift sample of Racecadotril.
References
- The Merck index, maryadele J.o. Neil. Eds, In: 13th edition, Published by Merck Research Lab, Division of Merck and Co., White House Station, NJ, USA. 2002, PP.8182.
- Reddy K,Babu J,Sudhakar P,Sharma M,Reddy G,Vyas K.Structural studies of racecadotril and its process impurities by NMR and mass spectroscopy pharmazie,2006;61 (12):994-8.
- Rao PS, Nappinnai M. UV and RP-HPLC Estimation of Racecadotril. Asian Journal of Chemistry. 2007;19(5):3697-702.
- . Reddy K, Babu J, Sudhakar P, Sharma M, Reddy G, Vyas K. Structural studies of racecadotril and its process impurities by NMR and mass spectroscopy Pharmazie.2006;61(12):994-8.
- Xu F, Yang L, Xu G. A rapid and validated HPLC method to quantify racecadotril metabolite, thiorphan, in human plasma using solid-phase extraction. J
- Chromatogr B Analyt Technol Biomed Life Sci. 2007;861(1):130-5.
- Xu Y, Huang J, Liu F, Gao S, Guo Q. Quantitative analysis of racecadotril metabolite in human plasma using a liquid chromatography/tandem mass spectrometry. J Chromatogr B Analyt Technol Biomed Life Sci. 2007;852(1- 2):101
- Vetrichelvan T, S.Prabakaran. New spectrophotometric methods for the determination of racecadotril in bulk drug and capsules. Indian Journal of Pharmaceutical Sciences. 2007;69(2):307-9.
- ICH Steering Committee,Validation of analytical procedures/methodology, ICH Harmonized Tripartite Guidelines, 1996.

This work is licensed under a Creative Commons Attribution 4.0 International License.


